PerformanceNotesArchive2
- Performance notes: archive 1 from ca. r11204 to r11670. Scan delay (rate limiting) tests. Timing ping selection improvements.
- Performance notes: archive 2 from ca. r11670 to r15840. nmap-perf performance improvements.
_FORTIFY_SOURCE. tryno equal. Timing ping frequency experiments.
Benchmark results of nmap r11670 vs. nmap-perf r11670 vs. nmap r11204
nmap -n -d2 -r --log-errors --max-retries 1 \
     -p 1-65535 scanme.nmap.org -oA perf-scanme
nmap -n -d2 -r --log-errors --max-retries 1 \
     -sP -PS21,23,80,3389 -PE -iL perf-down-hosts-2 -oA perf-down-ping
nmap -n -d2 -r --log-errors --max-retries 1 \
     -sP -PS21,23,80,3389 -PE -iL perf-up-hosts-2 -oA perf-up-ping
nmap -n -d2 -r --log-errors --max-retries 1 \
     -F -iL perf-random-hosts-2 -oA perf-random-F
nmap -n -d2 -r --log-errors --max-retries 1 \
     -F -iL perf-up-hosts-2 -oA perf-up-F
perf-random-hosts-2 is 704 random Internet IPs, culled of DHCP blocks. perf-down-hosts-2 is 200 addresses from that list, mostly down. perf-up-hosts-2 is 200 addresses from the random list, mostly up. (Except in the ucsd scans, where the lists have the same characteristics but the numbers are different.)
This table shows the times taken in the five benchmark scans, over three or four trials, on five different machines. Beneath each time is statistics for checking accuracy, in the following form:
| 0:02:08 10–34–355 | means that a scan took 0:02:08, had 10 hosts up, 34 open ports, and 355 closed ports. |
| scanme | down-ping | up-ping | random-F | up-F | |
| david/nmap-69 | 0:11:55 1–3–3 | 0:00:32 4–0–0 | 0:00:30 191–0–0 | 0:12:07 94–103–2558 | 0:08:49 200–6285–4907 |
| david/nmap-70 | 0:12:06 1–3–3 | 0:00:19 2–0–0 | 0:00:15 191–0–0 | 0:09:03 94–102–2807 | 0:08:55 200–6293–4894 |
| david/nmap-71 | 0:12:04 1–3–3 | 0:00:22 3–0–0 | 0:00:06 190–0–0 | 0:08:39 94–105–2863 | 0:08:02 200–6291–4884 |
| david/nmap-perf-69 | 0:09:52 1–3–3 | 0:00:25 4–0–0 | 0:00:03 188–0–0 | 0:09:18 95–107–2833 | 0:08:12 200–6277–4904 |
| david/nmap-perf-70 | 0:10:00 1–3–2 | 0:00:26 3–0–0 | 0:00:19 191–0–0 | 0:08:39 93–105–2767 | 0:08:07 200–6269–4912 |
| david/nmap-perf-71 | 0:08:59 1–3–3 | 0:00:21 3–0–0 | 0:00:16 190–0–0 | 0:09:17 95–106–2906 | 0:08:06 200–6292–4905 |
| david/nmap-r11204-69 | 0:09:35 1–3–3 | 0:01:35 4–0–0 | 0:00:12 190–0–0 | 0:09:17 97–78–2710 | 0:07:00 200–5067–4290 |
| david/nmap-r11204-70 | 0:09:36 1–3–3 | 0:00:49 3–0–0 | 0:00:25 191–0–0 | 0:07:57 95–76–2700 | 0:07:39 200–5099–4331 |
| david/nmap-r11204-71 | 0:09:34 1–3–3 | 0:01:28 2–0–0 | 0:00:14 190–0–0 | 0:08:35 95–77–2709 | 0:07:40 200–5093–4335 |
| flog/nmap-69 | 0:09:42 1–3–3 | 0:00:53 3–0–0 | 0:00:09 190–0–0 | 0:04:34 175–157–9425 | 0:05:26 200–6287–5128 |
| flog/nmap-70 | 0:08:15 1–3–3 | 0:00:54 5–0–0 | 0:00:27 191–0–0 | 0:04:24 176–154–9704 | 0:05:34 200–6292–5177 |
| flog/nmap-71 | 0:08:43 1–3–3 | 0:00:54 3–0–0 | 0:00:30 190–0–0 | 0:04:50 175–156–9517 | 0:05:19 200–6273–5131 |
| flog/nmap-perf-69 | 0:07:41 1–3–3 | 0:00:13 3–0–0 | 0:00:11 190–0–0 | 0:04:19 170–150–9326 | 0:05:16 200–6300–5143 |
| flog/nmap-perf-70 | 0:08:05 1–3–3 | 0:00:10 5–0–0 | 0:00:19 191–0–0 | 0:04:06 175–156–9711 | 0:05:26 200–6284–5134 |
| flog/nmap-perf-71 | 0:08:06 1–3–3 | 0:00:11 3–0–0 | 0:00:05 188–0–0 | 0:04:35 176–158–9514 | 0:05:18 200–6284–5136 |
| flog/nmap-r11204-69 | 0:07:42 1–3–3 | 0:00:24 3–0–0 | 0:00:22 190–0–0 | 0:04:34 173–154–9421 | 0:07:27 200–6272–5140 |
| flog/nmap-r11204-70 | 0:08:07 1–3–3 | 0:01:00 5–0–0 | 0:00:07 191–0–0 | 0:04:35 173–154–9620 | 0:06:49 200–6289–5129 |
| flog/nmap-r11204-71 | 0:07:51 1–3–3 | 0:00:53 3–0–0 | 0:00:24 190–0–0 | 0:04:35 176–157–9524 | 0:09:01 200–6252–5122 |
| goomba/nmap-69 | 0:07:47 1–3–3 | 0:00:21 3–0–0 | 0:00:03 190–0–0 | 0:08:09 178–169–27639 | 0:07:02 200–18418–14976 |
| goomba/nmap-70 | 0:07:06 1–3–3 | 0:00:12 3–0–0 | 0:00:03 190–0–0 | 0:08:06 177–169–27848 | 0:12:40 200–18417–14995 |
| goomba/nmap-71 | 0:06:46 1–3–3 | 0:00:46 4–0–0 | 0:00:02 190–0–0 | 0:07:00 177–171–27847 | 0:10:39 200–18418–14995 |
| goomba/nmap-perf-69 | 0:06:26 1–3–3 | 0:00:14 3–0–0 | 0:00:03 191–0–0 | 0:07:37 178–169–27601 | 0:06:44 200–18418–14995 |
| goomba/nmap-perf-70 | 0:06:10 1–3–3 | 0:00:14 3–0–0 | 0:00:03 191–0–0 | 0:06:53 176–169–27848 | 0:07:08 200–18418–14994 |
| goomba/nmap-perf-71 | 0:06:27 1–3–3 | 0:00:13 4–0–0 | 0:00:02 191–0–0 | 0:07:24 176–169–27848 | 0:07:57 200–18416–14994 |
| goomba/nmap-r11204-69 | 0:06:22 1–3–3 | 0:00:45 3–0–0 | 0:00:04 191–0–0 | 0:10:59 178–169–27848 | 0:14:30 200–18418–14995 |
| goomba/nmap-r11204-70 | 0:06:10 1–3–3 | 0:02:03 3–0–0 | 0:00:04 191–0–0 | 0:14:15 178–170–28136 | 0:13:19 200–18418–14995 |
| goomba/nmap-r11204-71 | 0:05:28 1–3–3 | 0:00:44 4–0–0 | 0:00:03 191–0–0 | 0:10:26 177–171–27848 | 0:13:51 200–18417–14993 |
| syn/nmap-69 | 0:00:00 0–0–0 | 0:04:52 3–0–0 | 0:00:03 190–0–0 | 0:02:23 176–161–9504 | 0:02:45 200–6309–5169 |
| syn/nmap-70 | 0:00:00 0–0–0 | 0:00:12 3–0–0 | 0:00:04 191–0–0 | 0:02:53 175–155–9504 | 0:02:21 200–6308–5171 |
| syn/nmap-71 | 0:00:00 0–0–0 | 0:00:20 3–0–0 | 0:00:03 190–0–0 | 0:02:07 175–154–9504 | 0:02:12 200–6309–5169 |
| syn/nmap-perf-69 | 0:00:00 0–0–0 | 0:00:12 3–0–0 | 0:00:03 190–0–0 | 0:02:01 176–161–9504 | 0:01:39 200–6309–5170 |
| syn/nmap-perf-70 | 0:00:00 0–0–0 | 0:00:09 3–0–0 | 0:00:02 191–0–0 | 0:02:07 175–155–9504 | 0:01:37 200–6309–5139 |
| syn/nmap-perf-71 | 0:00:01 0–0–0 | 0:00:10 3–0–0 | 0:00:02 190–0–0 | 0:01:40 175–155–9504 | 0:01:50 200–6309–5170 |
| syn/nmap-r11204-69 | 0:00:00 0–0–0 | 0:00:17 3–0–0 | 0:00:02 190–0–0 | 0:03:44 176–161–9504 | 0:06:09 200–6309–5170 |
| syn/nmap-r11204-70 | 0:00:00 0–0–0 | 0:01:46 3–0–0 | 0:00:02 190–0–0 | 0:03:43 176–155–9504 | 0:05:29 200–6307–5168 |
| syn/nmap-r11204-71 | 0:00:00 0–0–0 | 0:01:06 3–0–0 | 0:00:02 190–0–0 | 0:03:39 175–155–9503 | 0:03:19 200–6309–5170 |
| ucsd/nmap-51 | 0:02:10 1–3–3 | 0:01:07 14–0–0 | 0:00:07 558–0–0 | 0:16:20 421–1542–205476 | 0:42:35 921–2052–202989 |
| ucsd/nmap-52 | 0:02:11 1–3–3 | 0:00:59 14–0–0 | 0:00:10 556–0–0 | 0:16:22 417–1524–203353 | 0:42:27 921–2046–202106 |
| ucsd/nmap-53 | 0:02:10 1–3–3 | 0:00:57 14–0–0 | 0:00:07 556–0–0 | 0:16:13 417–1526–203370 | 0:45:22 921–2049–202007 |
| ucsd/nmap-54 | 0:02:10 1–3–3 | 0:01:00 15–0–0 | 0:00:07 555–0–0 | 0:13:50 419–1529–204573 | 0:47:00 921–2099–206662 |
| ucsd/nmap-perf-51 | 0:01:44 1–3–3 | 0:00:57 14–0–0 | 0:00:07 559–0–0 | 0:09:40 417–1528–203559 | 0:24:11 921–2058–203138 |
| ucsd/nmap-perf-52 | 0:01:43 1–3–3 | 0:01:05 14–0–0 | 0:00:06 556–0–0 | 0:09:45 417–1528–203515 | 0:27:34 921–2049–202073 |
| ucsd/nmap-perf-53 | 0:01:44 1–3–3 | 0:00:57 14–0–0 | 0:00:10 558–0–0 | 0:09:46 415–1521–202392 | 0:25:58 921–2057–201590 |
| ucsd/nmap-perf-54 | 0:01:43 1–3–3 | 0:00:49 15–0–0 | 0:00:06 557–0–0 | 0:16:42 419–1532–203774 | 0:29:32 921–2114–211621 |
| ucsd/nmap-r11204-51 | 0:01:43 1–3–3 | 0:01:00 14–0–0 | 0:00:06 558–0–0 | 0:10:25 418–1535–204432 | 0:45:07 921–2048–202843 |
| ucsd/nmap-r11204-52 | 0:01:43 1–3–3 | 0:01:02 14–0–0 | 0:00:05 557–0–0 | 0:11:16 417–1532–203695 | 0:47:33 921–2051–201913 |
| ucsd/nmap-r11204-53 | 0:01:43 1–3–3 | 0:00:52 14–0–0 | 0:00:06 555–0–0 | 0:11:16 418–1529–204080 | 0:42:15 921–2062–202657 |
| ucsd/nmap-r11204-54 | 0:01:43 1–3–3 | 0:01:00 15–0–0 | 0:00:06 555–0–0 | 0:11:10 425–1551–208468 | 0:51:41 921–2155–220668 |
I noticed only a few accuracy-related changes in the table. david/nmap-r11204/random-F found ≈25% fewer open ports for reasons I haven't investigated. (Maybe it went too fast? That was the only random-F scan where r11204 won.) david/nmap-perf-70/scanme missed 1 closed port, which is unusual but not unprecedented in nmap or nmap-perf. goomba had more total ports because it used /etc/services instead of nmap-services so -F didn't work.
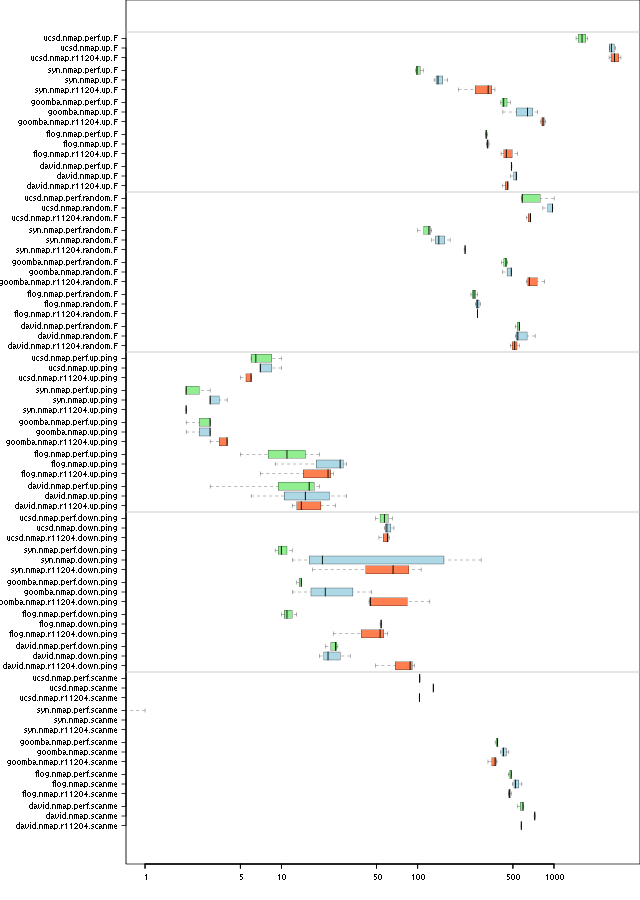
This chart contains the timing information from the above table. The whiskers in each box show the maximum and minimum time for each machine/benchmark combination; the heavy vertical line is the median time. More to the left is better. The different nmaps appear in the following order and colors:
- Green for nmap-perf r11670
- Blue for nmap r11670
- Orange for nmap r11204 (from before nmap-perf)
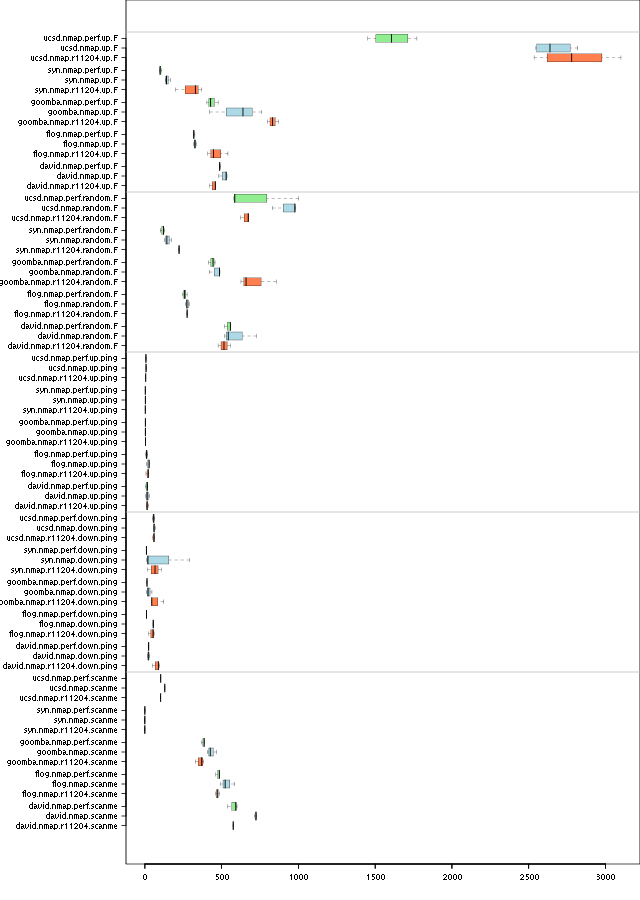
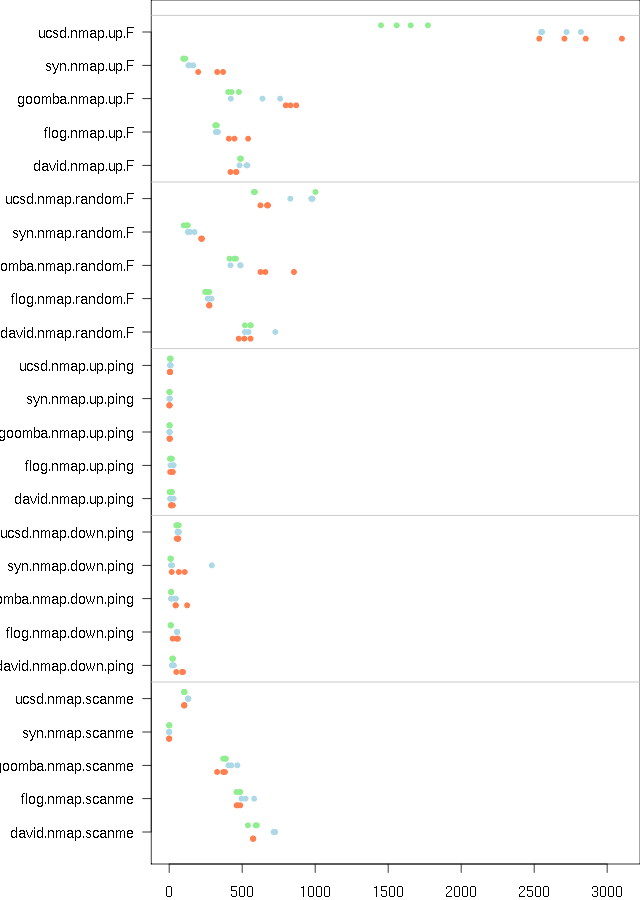
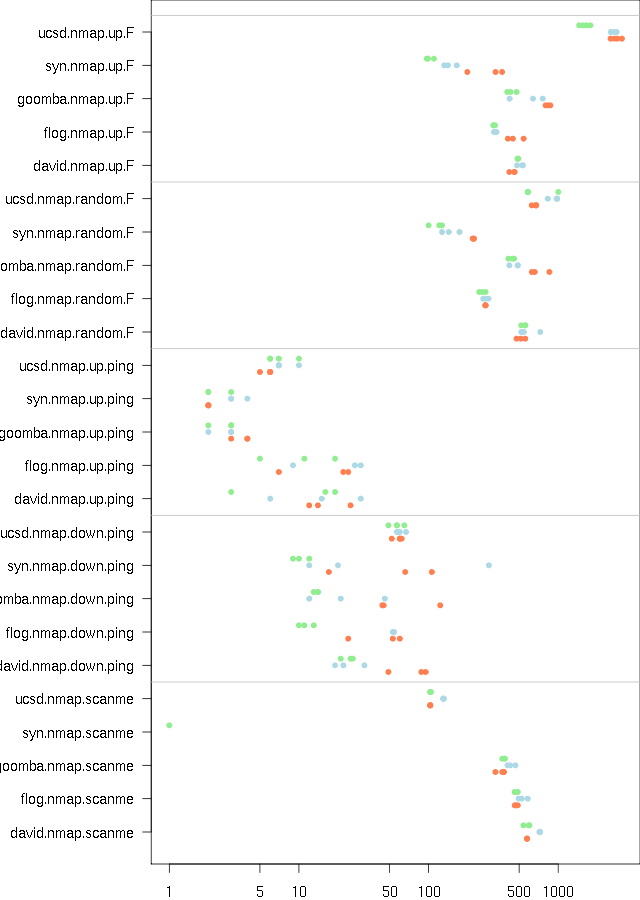
Alternate views of the graph: log scale, dots, dots log scale.
The log scale makes it easier to compare the short times. I find the dots chart easier to read but you have to know what the colors mean.
Global congestion control
I found an example where global congestion control is seriously constraining:
nmap -d2 scanme.nmap.org -d2 64.13.1-30.0 -PN -F -n --min-hostgroup 64
scanme gets a few responses right away and grows its congestion window to a healthy size. But the sending rate drops to less than 10 packets per second. Why?
**TIMING STATS** (35.0510s): IP, probes active/freshportsleft/
  retry_stack/outstanding/retranwait/onbench,
  cwnd/ssthresh/delay, timeout/srtt/rttvar/
   Groupstats (31/31 incomplete): 60/*/*/*/*/* 60.40/55/* 8880778/2178022/1675689
   64.13.134.52: 0/90/0/0/0/8 24.00/75/0 243796/71276/43130
   64.13.1.0: 1/81/0/2/1/17 10.00/75/0 8880778/-1/-1
   64.13.2.0: 1/82/0/1/0/17 10.00/75/0 8880778/-1/-1
   64.13.3.0: 4/81/0/4/0/15 10.00/75/0 8880778/-1/-1
   64.13.4.0: 2/82/0/3/1/15 10.00/75/0 8880778/-1/-1
   64.13.5.0: 1/85/0/1/0/14 10.00/75/0 8880778/-1/-1
   64.13.6.0: 3/81/0/3/0/16 10.00/75/0 8880778/-1/-1
   64.13.7.0: 2/81/0/3/1/16 10.00/75/0 8880778/-1/-1
   64.13.8.0: 1/84/0/1/0/15 10.00/75/0 8880778/-1/-1
   64.13.9.0: 4/78/0/5/0/18 10.00/75/0 8880778/-1/-1
   64.13.10.0: 0/80/0/2/1/18 2.00/2/0 772849/222769/137520
   64.13.11.0: 0/90/0/0/0/3 27.17/75/0 6865078/3061238/950960
   64.13.12.0: 3/89/0/3/0/8 10.00/75/0 8880778/-1/-1
   64.13.13.0: 2/84/0/3/0/4 34.84/75/0 7610620/2645884/1241184
   64.13.14.0: 4/85/0/4/0/11 10.00/75/0 8880778/-1/-1
   64.13.15.0: 3/86/0/3/0/11 10.00/75/0 8880778/-1/-1
   64.13.16.0: 2/87/0/2/0/11 10.00/75/0 8880778/-1/-1
   64.13.17.0: 3/89/0/3/0/8 10.00/75/0 8880778/-1/-1
   64.13.18.0: 1/89/0/1/0/10 10.00/75/0 8880778/-1/-1
   64.13.19.0: 1/87/0/1/0/12 10.00/75/0 8880778/-1/-1
   64.13.20.0: 4/89/0/4/0/7 10.00/75/0 8880778/-1/-1
   64.13.21.0: 2/87/0/3/1/10 10.00/75/0 8880778/-1/-1
   64.13.22.0: 1/86/0/1/0/13 10.00/75/0 8880778/-1/-1
   64.13.23.0: 2/89/0/2/0/9 10.00/75/0 8880778/-1/-1
   64.13.24.0: 1/89/0/1/0/10 10.00/75/0 8880778/-1/-1
   64.13.25.0: 2/88/0/2/0/10 10.00/75/0 8880778/-1/-1
   64.13.26.0: 3/87/0/4/1/9 10.00/75/0 8880778/-1/-1
   64.13.27.0: 2/88/0/3/0/10 10.00/75/0 8880778/-1/-1
   64.13.28.0: 1/89/0/1/0/10 10.00/75/0 8880778/-1/-1
   64.13.29.0: 3/87/0/4/1/9 10.00/75/0 8880778/-1/-1
   64.13.30.0: 1/90/0/1/0/9 10.00/75/0 8880778/-1/-1
All the other non-responsive hosts use up the global congestion window (60/60.40). Most of them have never gotten a response so their timeouts are the global timeout of almost 9 seconds. The global timeout is so high because of long RTTs on destination unreachable replies. (I repeated the experiment and the timeout settled to about 1.6 s, then once again and it was up near 10 s.) Because the congestion window is perpetually filled, we almost never get to send pings to scanme to expand it.
Timing pings
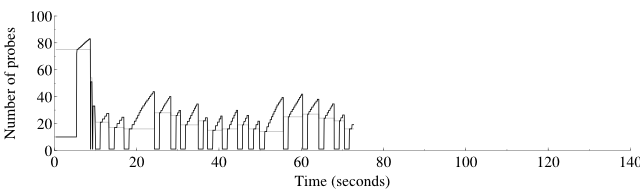
This is a picture of the effect of nmap-perf r11735, which sends a timing ping every 50 probes or 1.25 seconds, whichever comes first. First, using nmap trunk, here is a graph of the host (not global) congestion window and threshold for the scan
nmap -p 1-5000 -r -n -PN -d4 scanme.nmap.org
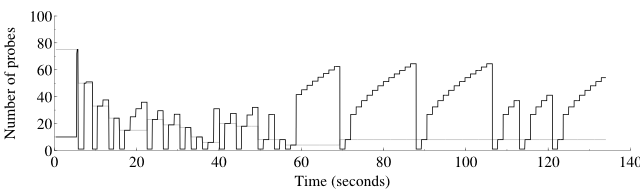
open 3 closed 3 filtered 4994
Overall sending rates: 112.77 packets / s, 4961.84 bytes / s.
Raw packets sent: 15084 (663.696KB) | Rcvd: 83 (3332B)
Here is the same scan with nmap-perf r11735, on the same x axis:
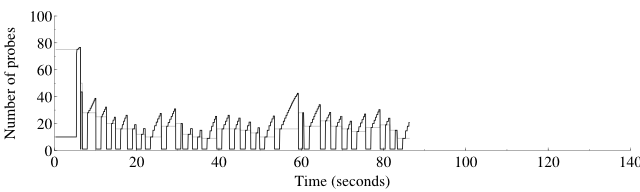
open 3 closed 3 filtered 4994
Overall sending rates: 117.93 packets / s, 5188.87 bytes / s.
Raw packets sent: 10155 (446.820KB) | Rcvd: 138 (5532B)
Notice that nmap-perf sent 1/3 fewer packets even though it sent 70% more pings (161 vs. 95). This is probably because the nmap scan had max_successful_tryno = 1 while the nmap-perf scan had it at 0.
The shapes of the two curves are quite different. Most significant is that in congestion avoidance mode, the nmap graph is curved while the nmap-perf graph is straight. Growth above the slow start threshold is supposed to be linear, so nmap-perf has it right. The curved shape is in fact a square root shape, and it is a sign that ping probes are hitting their maximum worth, which is not proportional to the sending rate. To see that one can look at the differential equations governing congestion avoidance:
So the curved shape is a result of the response rate scaled congestion control hitting its cap and becoming constant, no longer proportional to cwnd. Sending probes more often allows staying below this cap and staying proportional, without increasing the cap (which would only become a problem again at even higher scan rates). You can see some more square root graphs from long ago at the performance graphs page.
A repeat of the experiment:

open 3 closed 3 filtered 4994
Overall sending rates: 202.40 packets / s, 8905.50 bytes / s.
Raw packets sent: 10026 (441.144KB) | Rcvd: 30 (1212B)
Here is the same scan with nmap-perf r11735, on the same x axis:
open 3 closed 3 filtered 4994
Overall sending rates: 139.78 packets / s, 6150.36 bytes / s.
Raw packets sent: 10142 (446.248KB) | Rcvd: 135 (5412B)
The same shapes are visible, but this time nmap was faster. More tests are called for.
Benchmark of nmap r11737 vs. nmap-perf r11737
| scanme | down-ping | up-ping | random-F | up-F | |
| david/nmap-1 | 0:09:56 1–3–3 | 0:00:24 3–0–0 | 0:00:18 190–0–0 | 0:09:46 96–109–2859 | 0:07:29 200–6282–4803 |
| david/nmap-2 | 0:09:50 1–3–3 | 0:00:27 4–0–0 | 0:00:29 190–0–0 | 0:11:02 99–116–3010 | 0:07:38 200–6279–4801 |
| david/nmap-3 | 0:09:42 1–3–2 | 0:00:23 4–0–0 | 0:00:11 190–0–0 | 0:09:17 96–112–2852 | 0:07:51 200–6289–4806 |
| david/nmap-4 | 0:09:52 1–3–3 | 0:00:33 5–0–0 | 0:00:19 190–0–0 | 0:09:01 100–112–3147 | 0:07:50 200–6279–4797 |
| david/nmap-5 | 0:09:56 1–3–3 | 0:00:15 4–0–0 | 0:00:11 190–0–0 | 0:08:52 96–96–3014 | 0:07:43 200–6277–4807 |
| david/nmap-perf-1 | 0:18:24 1–3–3 | 0:00:37 4–0–0 | 0:00:28 190–0–0 | 0:09:12 95–110–2809 | 0:09:10 200–6280–4822 |
| david/nmap-perf-2 | 0:17:36 1–3–2 | 0:00:34 4–0–0 | 0:00:24 188–0–0 | 0:10:08 95–110–2880 | 0:08:39 200–6289–4804 |
| david/nmap-perf-3 | 0:17:24 1–3–3 | 0:00:23 4–0–0 | 0:00:09 190–0–0 | 0:09:53 95–109–3008 | 0:09:01 200–6284–4815 |
| david/nmap-perf-4 | 0:17:18 1–3–3 | 0:00:32 4–0–0 | 0:00:21 190–0–0 | 0:10:25 100–113–3191 | 0:09:07 200–6275–4810 |
| david/nmap-perf-5 | 0:18:29 1–3–3 | 0:00:28 4–0–0 | 0:00:26 190–0–0 | 0:10:10 98–109–3110 | 0:08:44 200–6289–4829 |
| goomba/nmap-1 | 0:06:27 1–3–3 | 0:00:15 4–0–0 | 0:00:04 190–0–0 | 0:10:36 182–172–28697 | 0:06:18 200–18418–14712 |
| goomba/nmap-2 | 0:06:46 1–3–3 | 0:00:14 4–0–0 | 0:00:03 190–0–0 | 0:10:14 181–172–28414 | 0:07:09 200–18416–14711 |
| goomba/nmap-3 | 0:06:54 1–3–3 | 0:00:12 4–0–0 | 0:00:04 190–0–0 | 0:08:10 182–172–28413 | 0:05:55 200–18418–14711 |
| goomba/nmap-4 | 0:06:29 1–3–3 | 0:00:12 4–0–0 | 0:00:03 190–0–0 | 0:07:27 182–173–28412 | 0:06:44 200–18419–14710 |
| goomba/nmap-5 | 0:06:32 1–3–3 | 0:00:14 4–0–0 | 0:00:03 190–0–0 | 0:08:29 181–172–28412 | 0:09:18 200–18406–14711 |
| goomba/nmap-perf-1 | 0:05:32 1–3–3 | 0:00:13 4–0–0 | 0:00:05 187–0–0 | 0:13:00 182–172–28692 | 0:08:55 200–18418–14709 |
| goomba/nmap-perf-2 | 0:05:56 1–3–3 | 0:00:11 4–0–0 | 0:00:07 190–0–0 | 0:11:46 181–172–28413 | 0:07:03 200–18418–14711 |
| goomba/nmap-perf-3 | 0:05:46 1–3–3 | 0:00:13 4–0–0 | 0:00:03 190–0–0 | 0:12:59 183–172–28413 | 0:06:49 200–18418–14711 |
| goomba/nmap-perf-4 | 0:06:07 1–3–3 | 0:00:13 4–0–0 | 0:00:04 190–0–0 | 0:11:01 183–171–28201 | 0:07:11 200–18419–14675 |
| goomba/nmap-perf-5 | 0:05:38 1–3–3 | 0:00:11 4–0–0 | 0:00:03 190–0–0 | 0:09:54 181–171–28695 | 0:07:31 200–18419–14710 |
These results are disappointing. Rate-related pings make the scan take longer in almost every case. My hypothesis for this is that nmap-perf is detecting when it's running too fast sooner than it used to. It doesn't get to coast for a little while at a rate higher than it should. nmap is just being a little more dangerous with its rate. I'll give up on this change.
Here's a graph of the time taken for nmap --pingtime X --max-retries 1 -p 1-5000 -r -n -PN -d2 scanme.nmap.org, for values of X between 100000 and 60000000 (0.1–60 s).
for n in 1 2 3 4 5 6 7 8 9 10 11 12; do
  echo >> pingtime.txt
  for a in 100000 250000 500000 1000000 1250000 1500000 2000000 \
           3000000 4000000 5000000 6000000 7000000 8000000 9000000 \
           10000000 20000000 30000000 40000000 50000000 60000000; do
    echo $n $a
    ./nmap --pingtime $a --max-retries 1 -p 1-5000 -r -n -PN -d2 scanme.nmap.org \
      > scanme-pingtime-$a-$n.nmap
    grep ^Nmap\  scanme-pingtime-$a-$n.nmap \
      | gawk "{print $a / 1000000. \" \" \$11}" >> pingtime.txt
  done
done
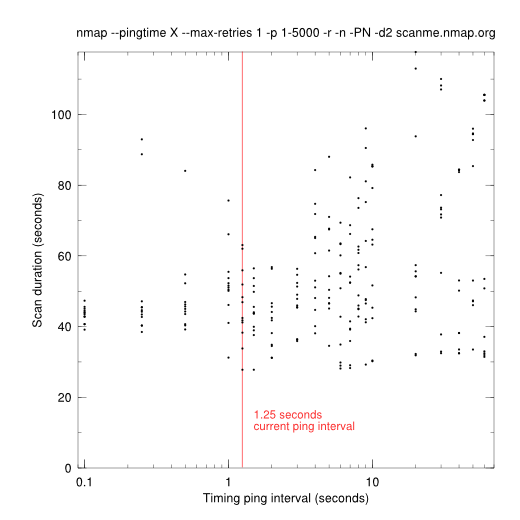
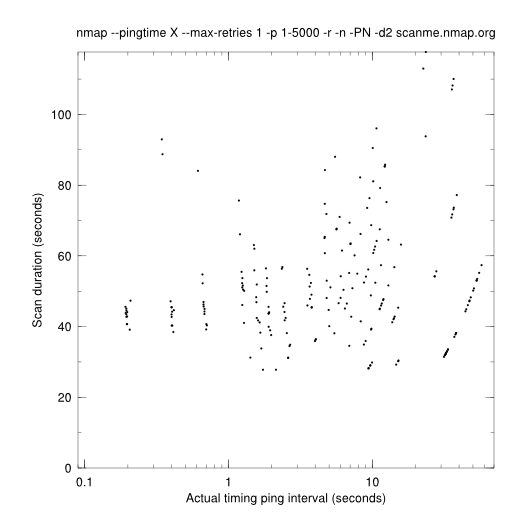
The above graph is a little misleading, because it shows the requested ping interval on the x axis, not the actual interval. Here is an graph adjusted for actual ping intervals, computed by dividing the scan duration by the number of "PING SENT" in the log. Note, for example, that the pings that were supposed to be sent every 0.1 s were sent about every 0.2 s.
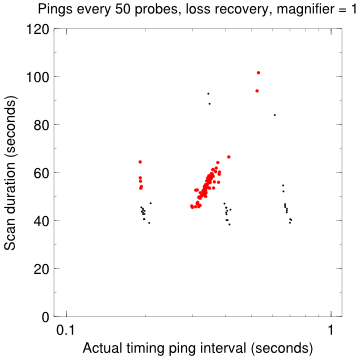
Here are samples of the difference in time taken with various ping timing tweaks. The x axis is changed to go from 0.1 to 1.0; with probe-based pings all actual ping intervals were in that range (the --pingtime option has some effect but not much). The small black dots are from the adjusted graph above.
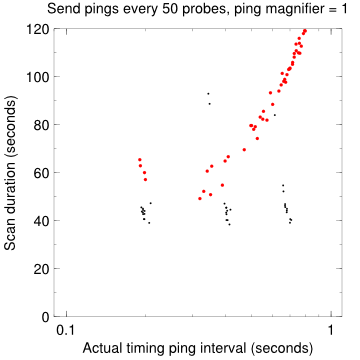
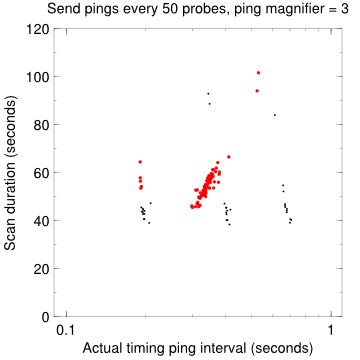
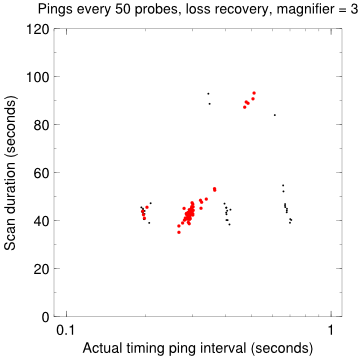
That last one (pings every 50 probes, loss recovery, magnifier = 3) looks pretty good. Most of the points are in the 40–50 second range, the same as nmap trunk with a 0.1 or 0.25 s requested pingtime. The outliers up higher are from high requested pingtimes (3–60 seconds). I don't know why the magnifier should have such a big effect. Two questions: Will that last combination outperform nmap trunk, and If so, what's the optimum ping magnifier?
Benchmark of nmap r11744 vs. nmap-perf r11744.
| scanme | down-ping | up-ping | random-F | up-F | |
| david/nmap-1 | 0:09:10 1–3–3 | 0:00:16 4–0–0 | 0:00:23 189–0–0 | 0:09:11 96–125–2804 | 0:07:36 200–6279–4703 |
| david/nmap-2 | 0:08:58 1–3–3 | 0:00:35 4–0–0 | 0:00:15 189–0–0 | 0:09:10 97–122–3004 | 0:08:07 200–6303–4704 |
| david/nmap-3 | 0:09:52 1–3–3 | 0:00:20 3–0–0 | 0:00:16 188–0–0 | 0:09:30 96–121–2908 | 0:07:40 200–6296–4706 |
| david/nmap-4 | 0:09:26 1–3–3 | 0:00:15 4–0–0 | 0:00:20 189–0–0 | 0:09:15 96–120–2862 | 0:07:50 200–6318–4696 |
| david/nmap-5 | 0:19:38 1–3–2 | 0:00:18 3–0–0 | 0:00:20 190–0–0 | 0:09:05 98–125–3095 | 0:07:40 200–6296–4800 |
| david/nmap-perf-1 | 0:09:14 1–3–2 | 0:00:16 4–0–0 | 0:00:16 189–0–0 | 0:09:18 95–125–2706 | 0:07:58 200–6308–4707 |
| david/nmap-perf-2 | 0:09:26 1–3–3 | 0:00:30 4–0–0 | 0:00:20 189–0–0 | 0:09:00 96–123–3002 | 0:07:49 200–6300–4680 |
| david/nmap-perf-3 | 0:09:21 1–3–3 | 0:00:18 3–0–0 | 0:00:17 189–0–0 | 0:08:44 95–112–2906 | 0:07:40 200–6301–4701 |
| david/nmap-perf-4 | 0:08:37 1–3–3 | 0:00:20 4–0–0 | 0:00:24 189–0–0 | 0:10:12 97–121–2918 | 0:07:54 200–6307–4674 |
| david/nmap-perf-5 | 0:09:19 1–3–3 | 0:00:15 3–0–0 | 0:00:21 190–0–0 | 0:08:50 97–124–3092 | 0:07:47 200–6289–4789 |
| flog/nmap-1 | 0:09:14 1–3–3 | 0:02:09 1–0–0 | 0:00:03 185–0–0 | 0:05:04 173–169–9377 | 0:04:48 200–6281–5036 |
| flog/nmap-2 | 0:08:06 1–3–3 | 0:01:00 0–0–0 | 0:00:10 189–0–0 | 0:04:30 174–179–9458 | 0:05:16 200–6299–5027 |
| flog/nmap-3 | 0:08:13 1–3–3 | 0:01:21 0–0–0 | 0:00:03 186–0–0 | 0:05:02 171–167–9271 | 0:04:33 200–6290–5035 |
| flog/nmap-4 | 0:07:34 1–3–3 | 0:01:18 0–0–0 | 0:00:08 190–0–0 | 0:04:36 173–172–9368 | 0:04:27 200–6286–5036 |
| flog/nmap-perf-1 | 0:07:38 1–3–3 | 0:01:08 1–0–0 | 0:00:14 189–0–0 | 0:04:22 174–171–9464 | 0:05:04 200–6303–5038 |
| flog/nmap-perf-2 | 0:07:41 1–3–3 | 0:01:47 1–0–0 | 0:00:15 190–0–0 | 0:04:22 171–171–9321 | 0:05:10 200–6294–5026 |
| flog/nmap-perf-3 | 0:08:01 1–3–3 | 0:01:32 1–0–0 | 0:00:08 190–0–0 | 0:04:27 174–167–9377 | 0:04:28 200–6286–5044 |
| flog/nmap-perf-4 | 0:08:13 1–3–3 | 0:00:47 0–0–0 | 0:00:18 189–0–0 | 0:04:07 168–165–9269 | 0:04:34 200–6295–5038 |
| goomba/nmap-1 | 0:06:59 1–3–3 | 0:00:13 4–0–0 | 0:00:03 189–0–0 | 0:08:33 180–185–28406 | 0:05:41 200–18432–14428 |
| goomba/nmap-2 | 0:06:19 1–3–3 | 0:00:28 5–0–0 | 0:00:04 188–0–0 | 0:08:53 179–183–28415 | 0:06:19 200–18432–14427 |
| goomba/nmap-3 | 0:06:38 1–3–3 | 0:00:12 4–0–0 | 0:00:03 189–0–0 | 0:07:54 178–183–28414 | 0:05:34 200–18432–14427 |
| goomba/nmap-4 | 0:05:53 1–3–3 | 0:00:15 3–0–0 | 0:00:04 189–0–0 | 0:07:38 177–183–28129 | 0:05:52 200–18432–14428 |
| goomba/nmap-perf-1 | 0:05:15 1–3–3 | 0:00:12 4–0–0 | 0:00:04 189–0–0 | 0:08:36 180–183–28227 | 0:05:51 200–18432–14428 |
| goomba/nmap-perf-2 | 0:05:08 1–3–3 | 0:00:24 5–0–0 | 0:00:06 184–0–0 | 0:08:22 179–183–28415 | 0:05:38 200–18432–14428 |
| goomba/nmap-perf-3 | 0:05:17 1–3–3 | 0:00:12 4–0–0 | 0:00:04 189–0–0 | 0:08:30 177–183–28130 | 0:06:16 200–18432–14428 |
| goomba/nmap-perf-4 | 0:05:24 1–3–3 | 0:00:12 3–0–0 | 0:00:04 189–0–0 | 0:07:45 177–183–28130 | 0:05:55 200–18432–14427 |
| syn/nmap-1 | 0:00:00 0–0–0 | 0:00:42 1–0–0 | 0:00:02 190–0–0 | 0:03:00 175–170–9456 | 0:01:21 200–6324–5074 |
| syn/nmap-2 | 0:00:00 0–0–0 | 0:00:26 1–0–0 | 0:00:03 190–0–0 | 0:02:39 175–171–9455 | 0:01:26 200–6324–5074 |
| syn/nmap-3 | 0:00:00 0–0–0 | 0:00:48 1–0–0 | 0:00:03 190–0–0 | 0:02:58 175–173–9550 | 0:01:29 200–6325–5074 |
| syn/nmap-4 | 0:00:00 0–0–0 | 0:00:23 2–0–0 | 0:00:02 190–0–0 | 0:02:28 176–176–9454 | 0:01:21 200–6324–5074 |
| syn/nmap-perf-1 | 0:00:00 0–0–0 | 0:00:36 1–0–0 | 0:00:03 190–0–0 | 0:03:01 175–170–9455 | 0:01:29 200–6325–4974 |
| syn/nmap-perf-2 | 0:00:00 0–0–0 | 0:01:11 1–0–0 | 0:00:03 190–0–0 | 0:02:55 175–171–9456 | 0:01:33 200–6325–5072 |
| syn/nmap-perf-3 | 0:00:00 0–0–0 | 0:00:50 2–0–0 | 0:00:03 190–0–0 | 0:02:28 176–173–9549 | 0:01:22 200–6325–5070 |
| syn/nmap-perf-4 | 0:00:00 0–0–0 | 0:02:49 1–0–0 | 0:00:02 190–0–0 | 0:02:49 176–176–9455 | 0:01:25 200–6324–4990 |
| ucsd/nmap-1 | 0:01:43 1–3–3 | 0:00:42 39–0–0 | 0:00:10 554–0–0 | 0:14:28 435–1576–212206 | 0:24:21 921–2002–198899 |
| ucsd/nmap-2 | 0:01:44 1–3–3 | 0:00:35 40–0–0 | 0:00:15 538–0–0 | 0:14:07 423–1538–205918 | 0:27:43 921–1991–195249 |
| ucsd/nmap-3 | 0:01:43 1–3–3 | 0:00:38 33–0–0 | 0:00:08 536–0–0 | 0:13:34 414–1526–202041 | 0:28:39 921–1987–193988 |
| ucsd/nmap-4 | 0:01:44 1–3–3 | 0:00:38 31–0–0 | 0:00:12 535–0–0 | 0:13:25 414–1533–202036 | 0:28:55 921–1979–194386 |
| ucsd/nmap-perf-1 | 0:00:51 1–3–3 | 0:00:34 39–0–0 | 0:00:05 554–0–0 | 0:16:12 430–1561–210576 | 0:28:42 921–1993–197337 |
| ucsd/nmap-perf-2 | 0:00:51 1–3–3 | 0:00:42 40–0–0 | 0:00:06 538–0–0 | 0:11:06 419–1539–204425 | 0:28:21 921–1990–195397 |
| ucsd/nmap-perf-3 | 0:00:50 1–3–3 | 0:00:36 33–0–0 | 0:00:06 538–0–0 | 0:10:10 414–1534–202664 | 0:26:50 921–1980–195001 |
| ucsd/nmap-perf-4 | 0:00:51 1–3–3 | 0:00:50 31–0–0 | 0:00:06 535–0–0 | 0:11:27 415–1541–203275 | 0:31:37 921–1977–194197 |
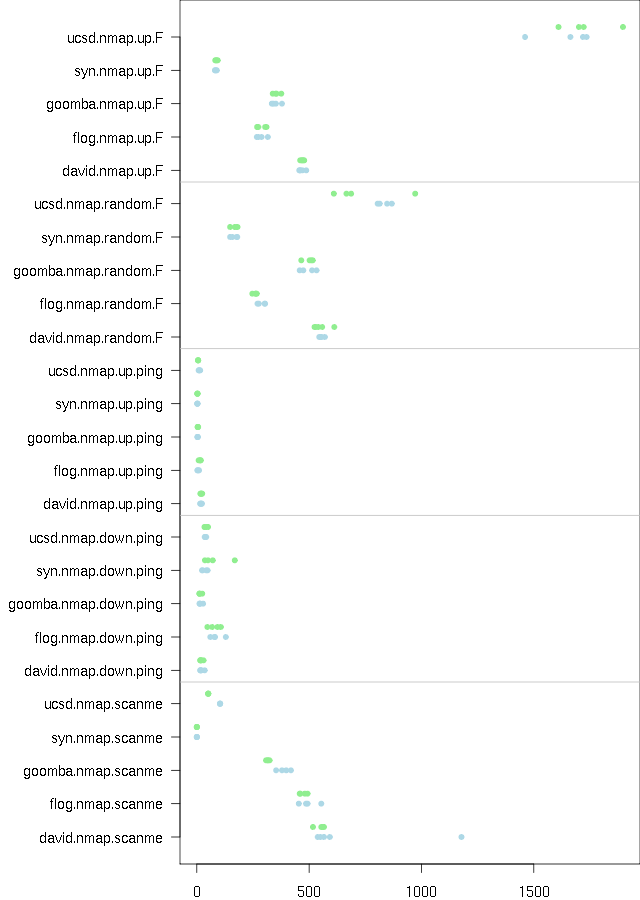
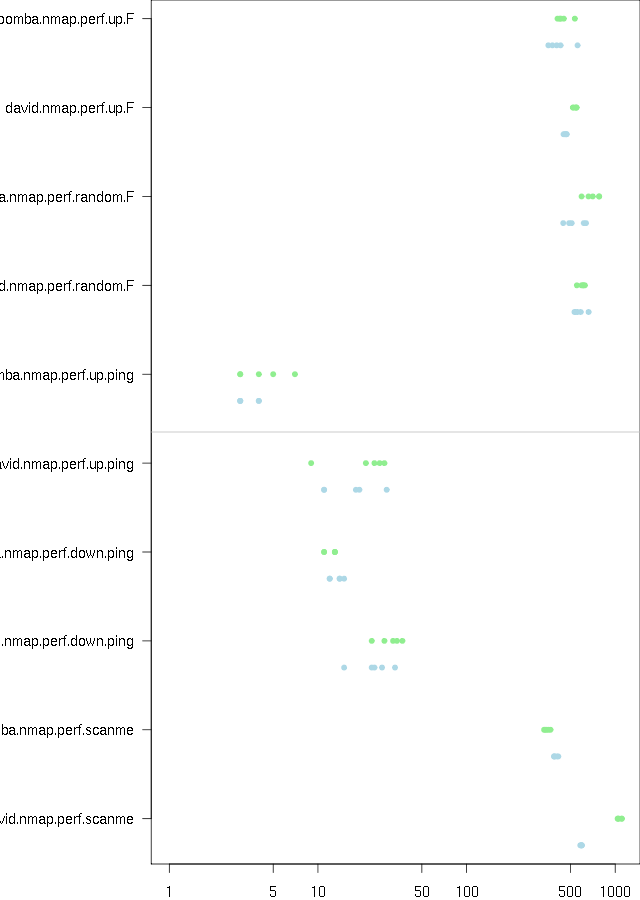
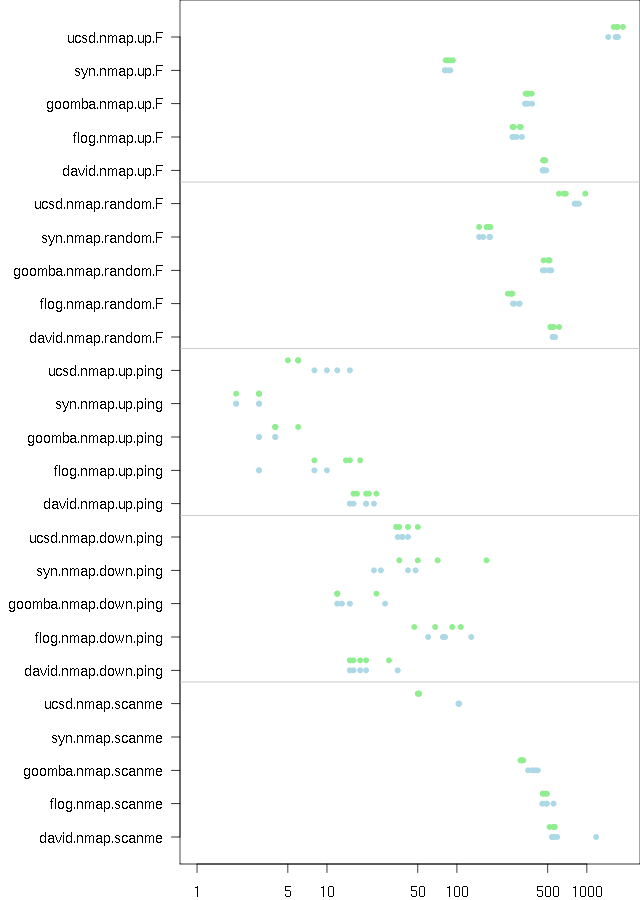
These results are hard to analyze. In most scans they seems to have had no effect, or a very small improvement. In a few cases nmap-perf looks to be slower: uscd/nmap-F, syn/down-ping. The scanme scans overall showed improvement; in ucsd/scanme, the time taken was roughly halved (104→51 seconds). The consistency of timing in this case is strong evidence that the improvement was not due to just chance.
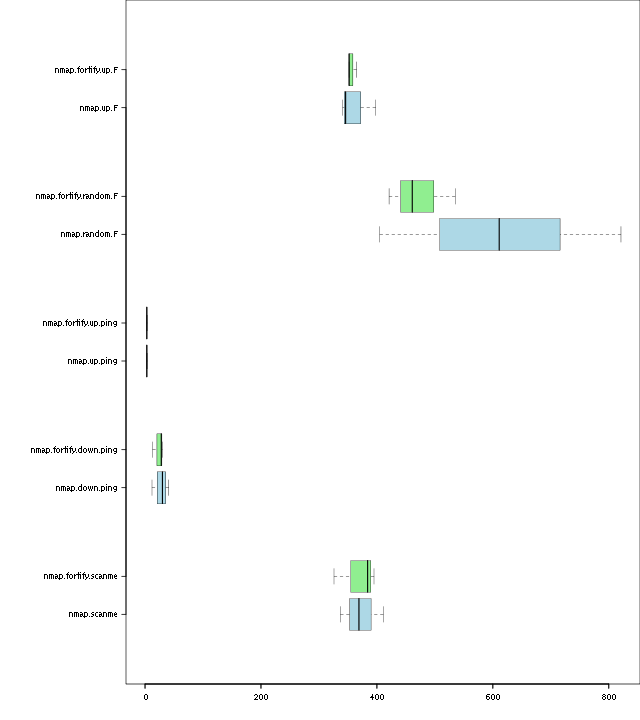
As usual, green is nmap-perf and blue is nmap.
tryno equal tests
A test of Daniel Roethlisberger's patch from http://seclists.org/nmap-dev/2009/q1/0387.html that checks for exact tryno equality in responses. This is a repeat of the standard nmap-perf benchmark I've been doing; see above for the exact scans these represent.
| 0:02:08 10–34–355 | means that a scan took 0:02:08, had 10 hosts up, 34 open ports, and 355 closed ports. |
| scanme | down-ping | up-ping | random-F | up-F | |
| gusto/nmap-1 | 0:10:15 1–3–3 | 0:00:36 2–0–0 | 0:00:22 187–0–0 | 0:08:48 93–114–2872 | 0:07:35 200–6278–4710 |
| gusto/nmap-2 | 0:09:53 1–3–3 | 0:00:36 2–0–0 | 0:00:12 187–0–0 | 0:10:30 95–120–2854 | 0:07:56 200–6267–4717 |
| gusto/nmap-3 | 0:09:51 1–3–3 | 0:00:32 1–0–0 | 0:00:22 187–0–0 | 0:08:51 93–114–2766 | 0:07:32 200–6284–4700 |
| gusto/nmap-tryno-1 | 0:09:54 1–3–3 | 0:01:18 2–0–0 | 0:00:21 187–0–0 | 0:06:56 92–83–2627 | 0:05:58 200–5088–4171 |
| gusto/nmap-tryno-2 | 0:10:07 1–3–3 | 0:00:33 2–0–0 | 0:00:10 187–0–0 | 0:07:01 94–83–2698 | 0:06:05 200–5110–4130 |
| gusto/nmap-tryno-3 | 0:10:02 1–3–3 | 0:00:45 2–0–0 | 0:00:23 187–0–0 | 0:08:37 94–83–2626 | 0:05:34 200–5097–4167 |
With the patch Nmap misses a lot of open and closed ports. In the random-F tests the patch found 28% fewer open ports and 6% fewer closed. In the up-F tests the patch found 19% fewer open and 12% fewer closed.
Benchmark of _FORTIFY_SOURCE=2
An overdue benchmark of _FORTIFY_SOURCE=2. The nmap scans are with r11810 and the nmap-fortify are with r11811. Defining _FORTIFY_SOURCE doesn't look to have an effect on performance.
| scanme | down-ping | up-ping | random-F | up-F | |
| nmap-1 | 0:06:09 1–3–3 | 0:00:30 3–0–0 | 0:00:03 188–0–0 | 0:13:41 174–178–27625 | 0:06:38 200–18426–14702 |
| nmap-2 | 0:06:51 1–3–3 | 0:00:41 3–0–0 | 0:00:03 188–0–0 | 0:10:11 176–181–27926 | 0:05:46 200–18425–14705 |
| nmap-3 | 0:05:37 1–2–3 | 0:00:12 5–0–0 | 0:00:04 187–0–0 | 0:06:45 178–181–27782 | 0:05:41 200–18426–14705 |
| nmap-fortify-1 | 0:05:26 1–3–3 | 0:00:30 2–0–0 | 0:00:04 188–0–0 | 0:07:01 174–178–27649 | 0:06:05 200–18426–14705 |
| nmap-fortify-2 | 0:06:35 1–3–3 | 0:00:28 3–0–0 | 0:00:03 188–0–0 | 0:08:55 177–181–28054 | 0:05:52 200–18425–14704 |
| nmap-fortify-3 | 0:06:24 1–3–3 | 0:00:13 5–0–0 | 0:00:03 188–0–0 | 0:07:41 177–178–27780 | 0:05:52 200–18426–14705 |