PerformanceGraphs
One of the challenges in effecting the massping migration was in increasing ultra_scan's speed when used to do host discovery.
A major factor affecting scan speed is parallelism, which is how many probes or hosts we process at a time. Nmap is able to alter its parallelism on the fly to deal with network conditions, but this needed some tuning for host discovery.
August 25
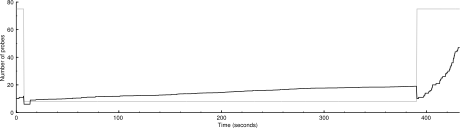
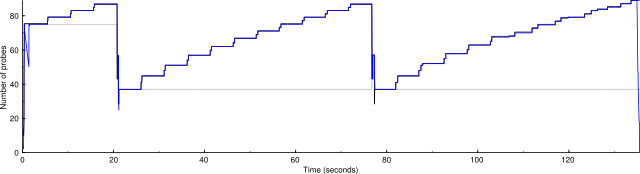
Here is a picture of massping's parallelism during a 10,000-host scan.
nmap --unprivileged -d2 -n -sP -PS -iL random-hosts-10000 (using massping)

There's no green line because massping doesn't have a congestion threshold. Each downward slope represents a drop, which is when no response is received to a probe but a response is received to a retransmission of that probe. You can see that massping is quite lenient when dealing with drops (decreasing parallelism by only 25%). The group size also recovers very quickly, so the parallelism is close to 50 for most of the time.
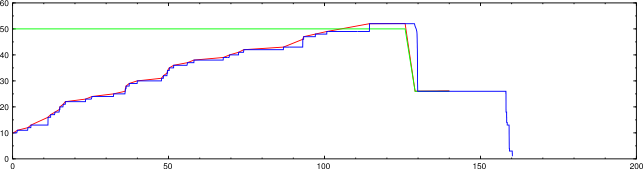
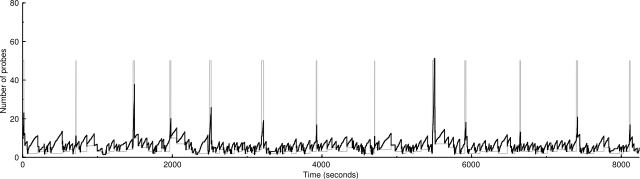
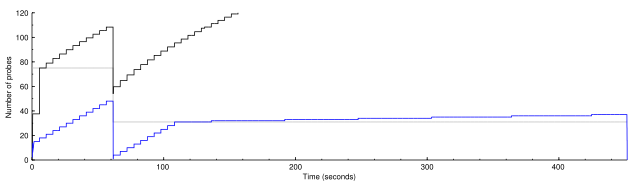
Here's what ultra_scan does during the same scan.
nmap --unprivileged -d2 -n -sP -PS -iL random-hosts-10000 (using ultra_scan)
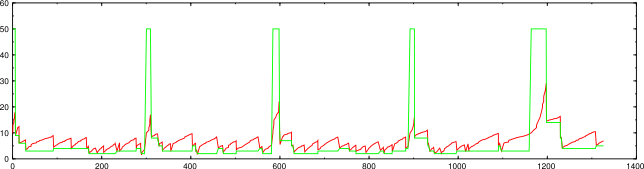
Each sharp vertical drop is a drop. The spikes in the congestion threshold (green line) are where a new group of hosts started and performance parameters were reset. There are about the same number of drops here, but their effect is devastating. ultra_scan drops parallelism by 50% on a drop, and also recovers very slowly. These combine to make this scan take 1,300 seconds compared to the 450 massping took.
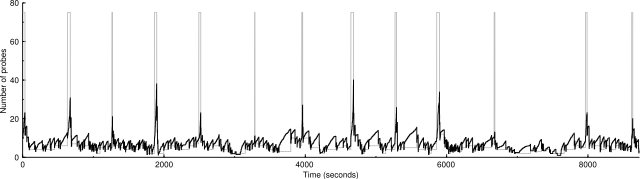
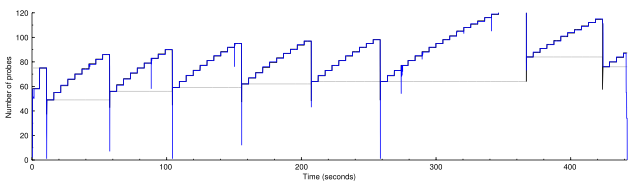
Some research showed that almost all the drops were caused by ICMP destination unreachable messages. For some reason, it's common that these come back in response to the second probe only, which counts as a drop. By not counting these types of messages (but still considering other types of drops), we get this performance.
nmap --unprivileged -d2 -n -sP -PS -iL random-hosts-10000 (using ultra_scan)
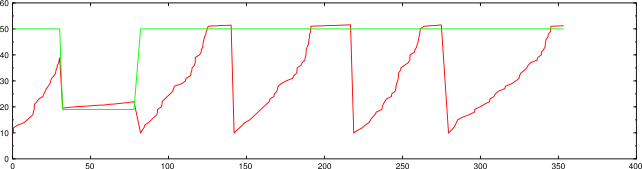
Here we see only one drop, in the first host group. The other places where the congestion window decreases are where a new host group starts. By special-casing those ICMP messages, we have reduced the scan time to 350 seconds.
August 28
Here we see a problem with scans involving more than one probe. The blue line is the number of active probes, which sometimes rises above the congestion window, though that should never happen. The group congestion control variables are not always consulted when doing retransmit, leading to this spiky appearance.
nmap -d2 --packet-trace -n -sP -PS1,3,5 -iL random-hosts-1000
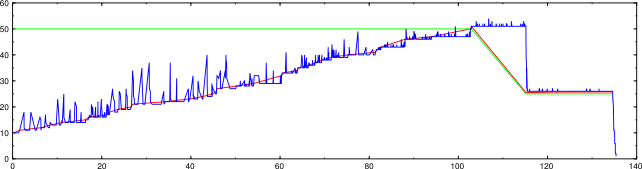
This was a pre-existing bug that also happens with port scans.
nmap -d2 -n -P0 -p22,80,113 -iL random-hosts-50
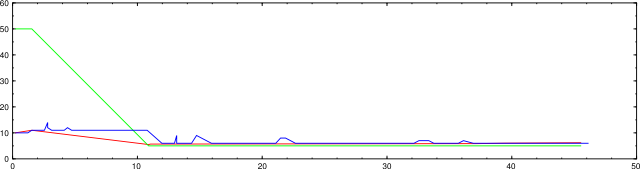
Here is the same scan after this was fixed.
nmap -d2 --packet-trace -n -sP -PS1,3,5 -iL random-hosts-1000
August 29
This is a scan of 50,000 hosts using the latest changes.
nmap -d2 --packet-trace -n -sP -PS -iL random-hosts-50000
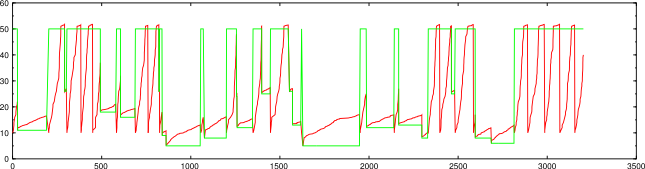
50000 IP addresses (1769 hosts up) scanned in 3207.314 seconds
Here's a test of a scan of 50,000 hosts using a host group size of 4096.
nmap -d2 --packet-trace -n -sP -PS -iL random-hosts-50000
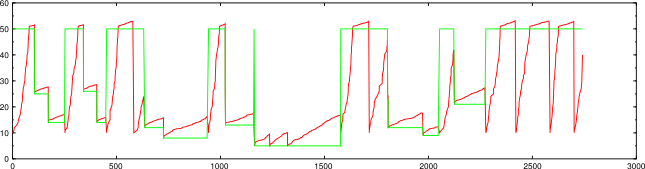
50000 IP addresses (1752 hosts up) scanned in 2742.269 seconds
The larger host group was faster but got fewer hosts, but it's within a reasonable variation for so many targets. Here's the another result of the same test, where the larger host group got more hosts:
2048: 50000 IP addresses (1716 hosts up) scanned in 3139.014 seconds
4096: 50000 IP addresses (1741 hosts up) scanned in 2257.307 seconds
September 4
nmap -n -d2 -sP -PS -iL random-hosts-5000
5000 IP addresses (155 hosts up) scanned in 389.284 seconds
Here's with less severe drops:
5000 IP addresses (153 hosts up) scanned in 432.306 seconds
Both of these had an unfortunate early drop.
Here's a 50,000-host scan, with the logic that ignores drops that come from ICMP destination unreachables disabled so there are many more drops.
50000 IP addresses (1727 hosts up) scanned in 8244.525 seconds
And here's with less severe drops:
50000 IP addresses (1739 hosts up) scanned in 8730.321 seconds
Less severe drops don't look to have much of an effect.
September 19
On the response rate scaled congestion control page, I claimed that per-host congestion control increments shouldn't be scaled as those for an entire group are, because an individual host acts more like a TCP stream. This may be true for ping scans, but the following graphs challenge that assumption for port scans.
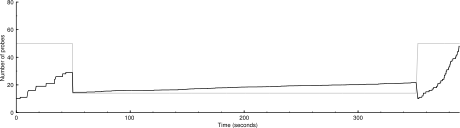
Here's a graph of the congestion control variables and the number of active probes for a port scan of two remote hosts. The black line is the congestion window, the gray line is the congestion threshold, and the blue line is the total number of active probes.
nmap -n -d3 --packet-trace -sS -p 1-10000 clem.mscd.edu scanme.nmap.org
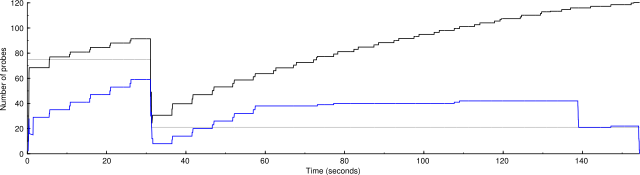
2 IP addresses (2 hosts up) scanned in 155.003 seconds
Notice that the number of probes never reaches the group congestion window. The reason for this is that each host has its own congestion control, which doesn't allow them to send enough probes to reach the group maximum. We also see the extremely slow growth starting at about 60 seconds once the host congestion windows exceed their thresholds. Also notice that the group congestion window grows artificially high, because, with no drops from the slow-growing hosts, there's nothing to hold it back.
Here's another scan, with the change that host congestion control increments are scaled like the those of the group congestion are.
2 IP addresses (2 hosts up) scanned in 136.122 seconds
We see that the number of active probes hugs the group congestion window closely. When one host experiences a drop, its congestion window drops to 1, but then the other host is allowed to send probes to fill the remaining capacity. This doesn't require that the number of probes always be close to the group congestion window; if enough hosts are experiencing drops at the same time, so that their congestion windows are low enough, then the number of active probes will be lower as in the first graph above.
October 2
I was puzzled as to why per-host scaled congestion control didn't have as big an effect as the graphs suggested. Here is a graph before (cc_scale_max = 1):
1 IP address (1 host up) scanned in 453.347 seconds
And after (cc_scale_max = 100):
1 IP address (1 host up) scanned in 443.424 seconds
It seemed to me that the total number of probes sent should be the area under the curve representing the number of active probes. The area under the second graph is over 2.5 times the area under the first graph, so why is it only 2% faster? I realized eventually that it's because the probes in the second graph have longer timeouts. Here are corresponding graphs of the timeouts:
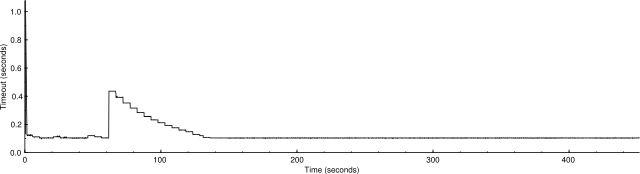
Average timeout: 0.109376 s.
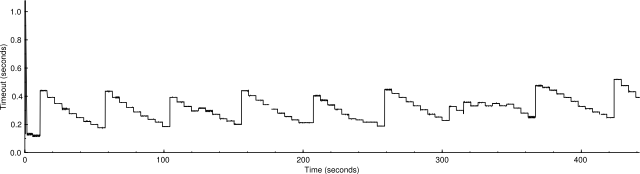
Average timeout: 0.28699 s.
It looks as if one part of ultra_scan is correcting for another. The scaled congestion control might otherwise make the scan go too quickly, but the timeouts are holding it back. This suggests that how fast it's going now is about as fast as it can safely go.
For completeness, here are the stats for cc_scale_max = 50:
1 IP address (1 host up) scanned in 467.934 seconds
Average timeout: 0.241261 s.