ResponseRateScaledCongestionControl
The congestion control algorithms used by ultra_scan are based on those described in RFC 2581, which are used in TCP.
Why host discovery is different from a TCP stream
Once a TCP stream is established, it's normal to expect an ACK to every packet sent. It's abnormal for 95% of them not to be responded to. ultra_scan, on the other hand, gets a response to only a fraction of its probes. If a probe gets no response, it's not counted as a drop as it would be with TCP. Therefore the calculated RTT is the RTT for only those hosts that ever responded.
The formulas in RFC 2581 assume that all sent probes will be ACKed. That means that during an RTT, we can expect to get cwnd number of ACKs (each of which will further contribute to the growth of the window). Define packet_ratio to be the quotient probes_sent / probes_replied_to. In TCP, packet_ratio is near 1, but in ultra_scan it's much lower. Instead of getting cwnd responses during an RTT, we get only packet_ratio × cwnd on average.
Impact
Suppose we're getting a response to 1% of probes (packet_ratio = 0.01). In congestion avoidance mode, we will increase cwnd by 1 / cwnd for every response. If we were getting cwnd responses per RTT, then the increase would be about 1 / cwnd × cwnd = 1 probe each RTT, which is what is prescribed by the RFC. But we're not getting that many responses; we're only getting 0.01 × cwnd. So the congestion window grows 100 times slower than it should.
When we don't get enough responses, the expected linear growth of congestion avoidance mode grows more like the square root function, whose shape is visible in the graphs below.
Scaling congestion window increments
Because we're only receiving packet_ratio × cwnd packets per RTT, it makes sense to multiply congestion window increments by 1 / packet_ratio so that the congestion window will behave as if we were getting cwnd responses per RTT.
USI->gstats->timing.cwnd += ping_magnifier * USI->perf.cc_incr / USI->gstats->timing.cwnd;
becomes
USI->gstats->timing.cwnd += ping_magnifier * USI->perf.cc_incr / USI->gstats->timing.cwnd * USI->gstats->probes_sent / USI->gstats->probes_replied_to;
And likewise in slow start mode (except that we cap slow start growth so that it doesn't overshoot ccthresh).
This is only for group congestion control variables. Host congestion control is unchanged, because per-host is more like a plain TCP stream.
New behavior
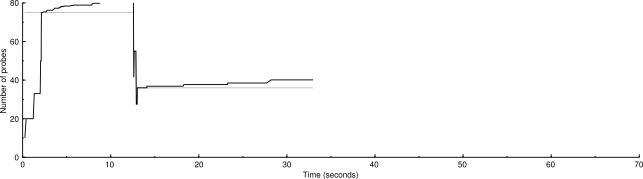
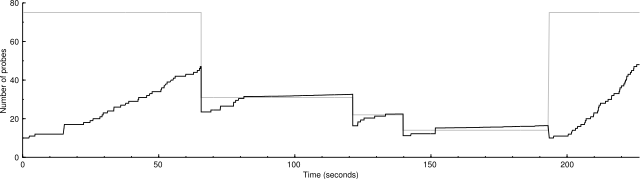
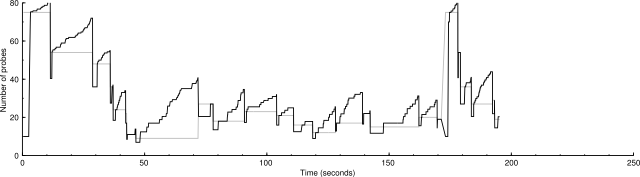
Here are benchmarks and graphs showing the performance of the two algorithms. The graphs show the congestion window in black and the congestion threshold in gray.
The scaled algorithm also has disabled the logic that ignores certain ICMP destination unreachable messages for the purposes of drop handling. So there are many more drops in these graphs than in current SVN. But the scaled congestion control copes with it admirably. The modified algorithm is better at finding the proper packet sending rate.
nmap -d2 -n -sP -iL random-hosts-500
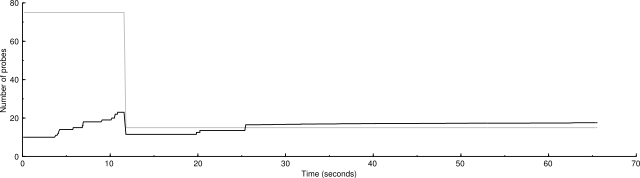
Unscaled: 500 IP addresses (34 hosts up) scanned in 65.627 seconds
Scaled: 500 IP addresses (34 hosts up) scanned in 33.121 seconds
nmap -d2 -n -sP -PS -iL random-hosts-5000
Unscaled: 5000 IP addresses (148 hosts up) scanned in 226.944 seconds
Scaled: 5000 IP addresses (147 hosts up) scanned in 195.556 seconds
nmap -d2 -n -sP -PA22,80,113 -iL random-hosts-10000
Here you can really see the shallow square root shape of the congestion avoidance mode.
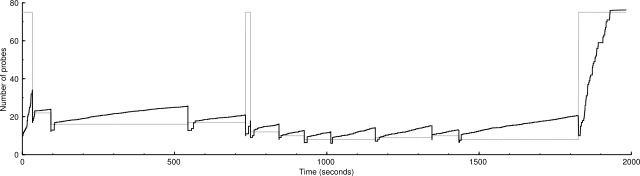
Unscaled: 10000 IP addresses (452 hosts up) scanned in 1984.355 seconds
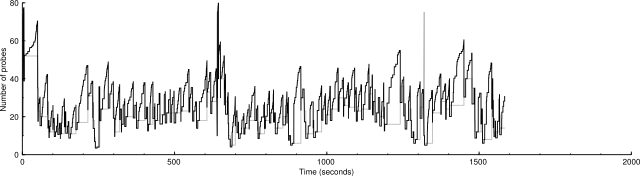
Scaled: 10000 IP addresses (454 hosts up) scanned in 1586.226 seconds
How does packet_ratio vary?
Here are statistics on packet_ratio from the 10,000-host test above.
Min.   : 17.29
1st Qu.: 51.19
Median : 58.84
Mean   : 57.04
3rd Qu.: 63.30
Max.   :105.00