FixedRate
How ScanRand does it
ScanRand takes a -b option that specifies the number of bytes per second to send.
See raw_sock_syn_scan in scanutil.c. It takes a textual bandwidth argument that looks like "0" or "1K" or "5M" or the like, and it's interpreted as the number of bytes per second to send. The code assumes 64 bytes per Ethernet frame, so if you send n bytes per second that turns into n/64 packets (or frames) per second. From scanutil.c:
/* We need to figure out how fast we're allowed to send packets.  We do this
 * by noting that our standard packet is 40 bytes, plus 14 from ethernet, yielding
 * 54 bytes on the wire.  Ah, but the minimum size for an ethernet frame is 64 bytes,
 * and until I get off my duff and properly support non-ether interfaces, that'll
 * have to be our per-packet cost.
 */
Then this "bandwidth" parameter is simply turned into a number of nanoseconds to sleep between sending packets:
/* XXX Need to incorporate time spent actually sending packets :-) */
packetsleep=(1000000*64)/i; /* 64 is minimum frame size */

...

if(packetsleep)usleep(packetsleep);
How Unicornscan does it
Unicornscan has a -r (--pps) option that specifies the number of packets per second to send. The default is 300.
There's a global struct settings_s object, s, and the member s.pps contains the requested packets per second. It is set by scan_setpps in options.c.
One big problem: s.pps is a uint32_t, so you can't specify a pps less than one; e.g., --pps 0.2 for one packet every five seconds.
Delay types
Just like ScanRand, Unicornscan manages the sending rate by delaying between transmissions. There are three ways to delay: TSC (time stamp counter), GTOD (gettimeofday), and sleep. You choose which one to use with the -d (--delay-type) option. You can see which one is in use with -vv: "Using TSC delay".
The delay interface is defined in unilib/xdelay.c. It has three functions:
init_tslotcalibrates the delay engine (calibration occurs once per workunit).start_tslotsignals that timeslot is starting.end_tslotwaits until the end of a timeslot started bystart_tslot.
These are just wrappers for delay-type-specific functions (tsc_init_tslot etc.).
TSC delay (unilib/tsc.c)
This uses a 64-bit tick counter returned by the RDTSC assembly-language instruction or its equivalent on other platforms.
GTOD delay (unilib/gtod.c)
This uses the result of gettimeofday, coerced from a struct timeval into a 64-bit value (tv_sec in the high 32 bits, tv_usec in the low 32 bits). (Seems broken? Taking the difference of two such values won't give you anything meaningful if the high 32 bits are non-zero.)
sleep delay (unilib/sleep.c)
This also uses gettimeofday, but instead of using a busy loop to wait like GTOD delay does, it calls nanosleep with the difference of two times.
Delay calibration
TSC and GTOD delays, in their initialization functions (tsc_init_tslot and gtod_init_tslot), run a calibration meant to translate ticks into seconds.
The calibration runs a nanosleep for a tenth of a second (actually 0.100000001 second), gets the difference in ticks during that time, multiplies by 10 to get the ticks for one second, then divides by the pps to get a number of ticks to delay between each packet.
The delays for TSC and GTOD are accomplished through a shameless busy wait. The busy waits are CPU hogs. With TSC and GTOD delays the unisend sub-process uses 80%–90% CPU. With sleep delay it's close to zero, even lower than Nmap.
Effecting the delay
The function _send_packet (note leading underscore) in scan_progs/send_packet.c is bracketed by calls to start_tslot and end_tslot, that's all. So just like ScanRand, Unicornscan uses an unstable timing process that doesn't take into account the time spent sending packets and doing other computation. (Maybe that's why they say about the --pps option, "as you go higher it gets less accurate"?)
See the function send_packet (no leading underscore). It doesn't send a single packet (that's what _send_packet does), rather it's the main loop for the unisend sub-process. See scan_progs/entry.c, the main source file common to unisend and unilisten. The main loop receives work units from the controller and executes them.
How Nmap might do it
Development is happening in svn://svn.insecure.org/nmap-exp/david/nmap-fixed-rate.
PacketTrace::trace* already gets called for every packet sent, so we have a count of packets and bytes sent and received.
The sending has to be smooth, not bursty. Say the line has been idle for 10 seconds, and the requested packet rate is 30 per second. It's not okay to immediately send 300 packets to make the average right. Those 10 seconds are simply lost. Similarly, you can't just send 30 packets in the first 10 milliseconds of every second.
Well, maybe you can be slightly bursty. Other factors in Nmap make it hard to have a completely regular sending rate. There are unavoidable delays, like the pcap reads, that you have to work around. To keep a desired rate, you have to allow the sends to "catch up" a bit if they've fallen behind. That means that you get some probes sent faster than the sending rate strictly allows in order to keep up the average. What are we really worried about with bursty sends, anyway? Overflowing buffers or other resources of the target or intermediate nodes. If the bursts are not excessive then there's no problem.
I was thinking of having some kind of feedback loop that dynamically adjusts the delay based on how close we are to the desired rate. But a stable static rate fixer would do just the same thing.
I think we could set the rate based on either packets or bytes. I'm thinking of a command-line interface like --rate=1k or --rate=1kp for 1,000 packets per second, and --rate=1kb for 1,000 bytes per second. (Or 1,024; ScanRand uses binary multipliers.) Or even b for bits and B for bytes, but maybe that's too clever.
You can think of a rate fixer as a rate limiter. The sending rate is never going to be better than completely unthrottled Nmap; even if the user asks for a trillion packets per second, that's the best we can do. So basically it means we take out all other restrictions and slow the scan down if we need to, otherwise let it go as fast as it can.
Wait... that's exactly the same as --scan-delay. Except --scan-delay is per-host, and we want it to be global. And it needs more resolution than an integer number of milliseconds.
I guess we should disable timing pings when fixed-rate scanning.
Some sample stable rate-fixing code from DemoSat
/* This is the sample rate throttle. next_timestamp advances in
   units of SAMPLE_PERIOD, converted from milliseconds to clock
   cycles. We sleep after each sample long enough to keep the
   sample rate near SAMPLE_FREQUENCY. */
/* We want this cycle to end whenever the last cycle ended plus
   the sample period. */
next_timestamp += F_CPU / 1000 * SAMPLE_PERIOD;
timestamp = get_timestamp();
/* Find out how long we have to wait to get there. */
diff = next_timestamp - timestamp;
/* If diff is positive, we need to sleep. If not, we're past
   where we're supposed to be, so catch up the target
   timestamp. */
if ((signed long) diff > 0)
        msleep(diff * 1000 / F_CPU);
else
        /* If we're already past where we're supposed to be,
           catch up the target timestamp. */
        next_timestamp = timestamp;
Now that I check, that's exactly how enforce_scan_delay in timing.cc works. But that's not what's used in normal scanning. The value used by --scan-delay is usually enforced in HostScanStats::sendOK, which uses an unstable scheduler like the other scanners.
Statistics
March 21, 2008
r6962
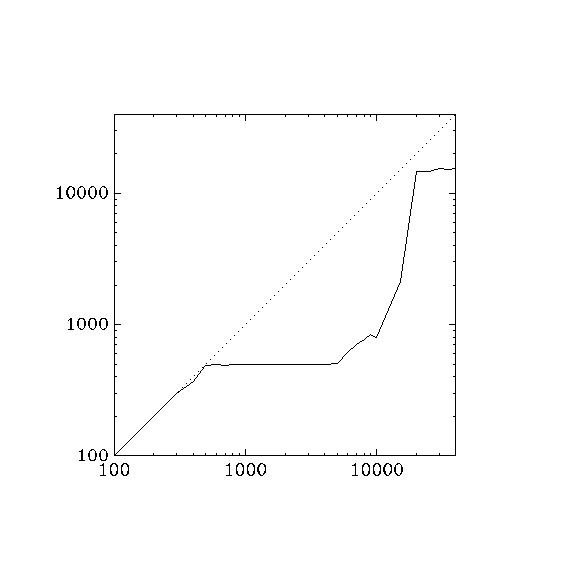
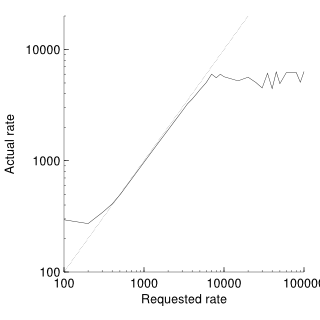
With r6962 on localhost, notice that the rate starts to lag above 300 packets / second. This might have to do with the 2000 μs (= 1/500 s) minimum delay enforced by get_pcap_result on readip_pcap. But then around 20000 packets / second, it jumps up to around 15000, which is what I get with ./nmap -v -T5 localhost.
for a in 100 200 300 400 500 600 700 800 900 \
1000 2000 3000 4000 5000 6000 7000 8000 9000 \
10000 15000 20000 25000 30000 35000 40000; do\
  echo ./nmap -PN --rate $a -v localhost; \
  ./nmap -PN --rate $a -v localhost >localhost.log 2>/dev/null; \
  grep ^Overall localhost.log; \
done

./nmap -PN --rate 100 -v localhost
Overall sending rates: 99.98 packets / s, 4399.14 bytes / s.
./nmap -PN --rate 200 -v localhost
Overall sending rates: 198.77 packets / s, 8745.67 bytes / s.
./nmap -PN --rate 300 -v localhost
Overall sending rates: 297.27 packets / s, 13079.91 bytes / s.
./nmap -PN --rate 400 -v localhost
Overall sending rates: 370.40 packets / s, 16297.39 bytes / s.
./nmap -PN --rate 500 -v localhost
Overall sending rates: 489.07 packets / s, 21518.93 bytes / s.
./nmap -PN --rate 600 -v localhost
Overall sending rates: 492.88 packets / s, 21686.88 bytes / s.
./nmap -PN --rate 700 -v localhost
Overall sending rates: 491.92 packets / s, 21644.28 bytes / s.
./nmap -PN --rate 800 -v localhost
Overall sending rates: 495.31 packets / s, 21793.66 bytes / s.
./nmap -PN --rate 900 -v localhost
Overall sending rates: 496.30 packets / s, 21837.20 bytes / s.
./nmap -PN --rate 1000 -v localhost
Overall sending rates: 493.12 packets / s, 21697.43 bytes / s.
./nmap -PN --rate 2000 -v localhost
Overall sending rates: 494.59 packets / s, 21761.83 bytes / s.
./nmap -PN --rate 3000 -v localhost
Overall sending rates: 497.43 packets / s, 21886.99 bytes / s.
./nmap -PN --rate 4000 -v localhost
Overall sending rates: 499.91 packets / s, 21996.00 bytes / s.
./nmap -PN --rate 5000 -v localhost
Overall sending rates: 502.36 packets / s, 22104.03 bytes / s.
./nmap -PN --rate 6000 -v localhost
Overall sending rates: 607.75 packets / s, 26741.02 bytes / s.
./nmap -PN --rate 7000 -v localhost
Overall sending rates: 709.12 packets / s, 31201.07 bytes / s.
./nmap -PN --rate 8000 -v localhost
Overall sending rates: 775.67 packets / s, 34129.51 bytes / s.
./nmap -PN --rate 9000 -v localhost
Overall sending rates: 837.47 packets / s, 36848.60 bytes / s.
./nmap -PN --rate 10000 -v localhost
Overall sending rates: 796.11 packets / s, 35028.84 bytes / s.
./nmap -PN --rate 15000 -v localhost
Overall sending rates: 2138.59 packets / s, 94097.75 bytes / s.
./nmap -PN --rate 20000 -v localhost
Overall sending rates: 14675.68 packets / s, 645729.93 bytes / s.
./nmap -PN --rate 25000 -v localhost
Overall sending rates: 14673.67 packets / s, 645641.53 bytes / s.
./nmap -PN --rate 30000 -v localhost
Overall sending rates: 15396.63 packets / s, 677451.79 bytes / s.
./nmap -PN --rate 35000 -v localhost
Overall sending rates: 15025.54 packets / s, 661123.72 bytes / s.
./nmap -PN --rate 40000 -v localhost
Overall sending rates: 15364.63 packets / s, 676043.72 bytes / s.
Here's a graph of the non-linearity. Adjusting the pcap read time doesn't seem to have an effect.
gawk 'END { print ""; print "1 1"; print "40000 40000"; } \
/nmap/ { printf "%f ", $4 } \
/^Overall/ { printf "%f\n", $4 }' \
| graph -Tpng -x 100 40000 -y 100 40000 -l X -l Y > tmp.png
Here's the same thing for Unicornscan, for comparison.
for a in 100 200 300 400 500 600 700 800 900 \
1000 2000 3000 4000 5000 6000 7000 8000 9000 \
10000 15000 20000 25000 30000 35000 40000; do \
  echo unicornscan -vv --pps $a localhost; \
  unicornscan -vv --pps $a localhost 2>/dev/null | grep ^average; \
done

unicornscan -vv --pps 100 localhost
average `59.66' packets per second at end of run
unicornscan -vv --pps 200 localhost
average `161.68' packets per second at end of run
unicornscan -vv --pps 300 localhost
average `277.72' packets per second at end of run
unicornscan -vv --pps 400 localhost
average `374.99' packets per second at end of run
unicornscan -vv --pps 500 localhost
average `434.97' packets per second at end of run
unicornscan -vv --pps 600 localhost
average `498.03' packets per second at end of run
unicornscan -vv --pps 700 localhost
average `586.44' packets per second at end of run
unicornscan -vv --pps 800 localhost
average `541.97' packets per second at end of run
unicornscan -vv --pps 900 localhost
average `769.54' packets per second at end of run
unicornscan -vv --pps 1000 localhost
average `618.47' packets per second at end of run
unicornscan -vv --pps 2000 localhost
average `1731.11' packets per second at end of run
unicornscan -vv --pps 3000 localhost
average `1557.22' packets per second at end of run
unicornscan -vv --pps 4000 localhost
average `3749.61' packets per second at end of run
unicornscan -vv --pps 5000 localhost
average `3389.48' packets per second at end of run
unicornscan -vv --pps 6000 localhost
average `871.16' packets per second at end of run
unicornscan -vv --pps 7000 localhost
average `6824.42' packets per second at end of run
unicornscan -vv --pps 8000 localhost
average `4493.93' packets per second at end of run
unicornscan -vv --pps 9000 localhost
average `4372.78' packets per second at end of run
unicornscan -vv --pps 10000 localhost
average `7445.69' packets per second at end of run
unicornscan -vv --pps 15000 localhost
average `13908.14' packets per second at end of run
unicornscan -vv --pps 20000 localhost
average `18518.52' packets per second at end of run
unicornscan -vv --pps 25000 localhost
average `23899.47' packets per second at end of run
unicornscan -vv --pps 30000 localhost
average `15571.49' packets per second at end of run
unicornscan -vv --pps 35000 localhost
average `32751.83' packets per second at end of run
unicornscan -vv --pps 40000 localhost
average `36617.59' packets per second at end
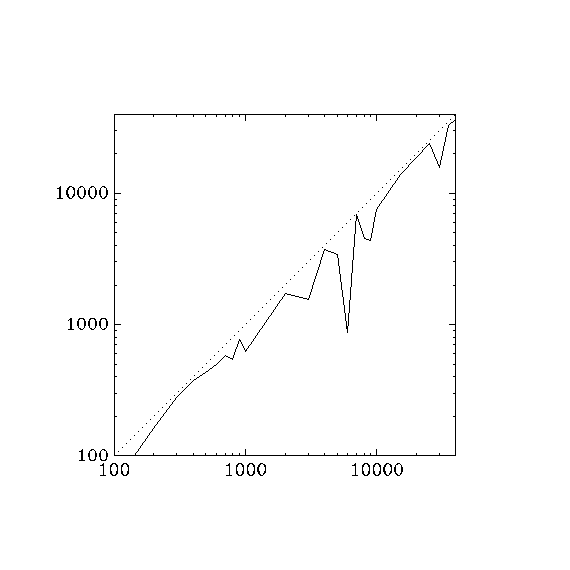
Unicornscan also lags, but more consistently.
Also
Decoys are bursty: if you ask for five decoys and a rate of one packet per second, you get five sends in a burst every five seconds.
I think host scheduling is wrong. All retransmits for each port happen at once?
r6963
I took out the "catch up" line.
./nmap -PN --rate 100 -v localhost
Overall sending rates: 100.06 packets / s, 4402.51 bytes / s.
./nmap -PN --rate 200 -v localhost
Overall sending rates: 200.03 packets / s, 8801.50 bytes / s.
./nmap -PN --rate 300 -v localhost
Overall sending rates: 300.09 packets / s, 13203.98 bytes / s.
./nmap -PN --rate 400 -v localhost
Overall sending rates: 400.09 packets / s, 17603.95 bytes / s.
./nmap -PN --rate 500 -v localhost
Overall sending rates: 499.85 packets / s, 21993.46 bytes / s.
./nmap -PN --rate 600 -v localhost
Overall sending rates: 600.27 packets / s, 26412.07 bytes / s.
./nmap -PN --rate 700 -v localhost
Overall sending rates: 700.51 packets / s, 30822.28 bytes / s.
./nmap -PN --rate 800 -v localhost
Overall sending rates: 799.02 packets / s, 35157.03 bytes / s.
./nmap -PN --rate 900 -v localhost
Overall sending rates: 899.26 packets / s, 39567.27 bytes / s.
./nmap -PN --rate 1000 -v localhost
Overall sending rates: 999.05 packets / s, 43958.27 bytes / s.
./nmap -PN --rate 2000 -v localhost
Overall sending rates: 1997.77 packets / s, 87902.00 bytes / s.
./nmap -PN --rate 3000 -v localhost
Overall sending rates: 2994.27 packets / s, 131748.03 bytes / s.
./nmap -PN --rate 4000 -v localhost
Overall sending rates: 3974.50 packets / s, 174877.93 bytes / s.
./nmap -PN --rate 5000 -v localhost
Overall sending rates: 4992.59 packets / s, 219674.01 bytes / s.
./nmap -PN --rate 6000 -v localhost
Overall sending rates: 6010.63 packets / s, 264467.54 bytes / s.
./nmap -PN --rate 7000 -v localhost
Overall sending rates: 6956.37 packets / s, 306080.16 bytes / s.
./nmap -PN --rate 8000 -v localhost
Overall sending rates: 7995.91 packets / s, 351819.88 bytes / s.
./nmap -PN --rate 9000 -v localhost
Overall sending rates: 8943.57 packets / s, 393516.90 bytes / s.
./nmap -PN --rate 10000 -v localhost
Overall sending rates: 9812.62 packets / s, 431755.25 bytes / s.
./nmap -PN --rate 15000 -v localhost
Overall sending rates: 6723.78 packets / s, 295846.48 bytes / s.
./nmap -PN --rate 20000 -v localhost
Overall sending rates: 3805.22 packets / s, 167429.53 bytes / s.
./nmap -PN --rate 25000 -v localhost
Overall sending rates: 3563.24 packets / s, 156782.69 bytes / s.
./nmap -PN --rate 30000 -v localhost
Overall sending rates: 3565.82 packets / s, 156896.07 bytes / s.
./nmap -PN --rate 35000 -v localhost
Overall sending rates: 3445.89 packets / s, 151619.19 bytes / s.
./nmap -PN --rate 40000 -v localhost
Overall sending rates: 3440.28 packets / s, 151372.38 bytes / s.
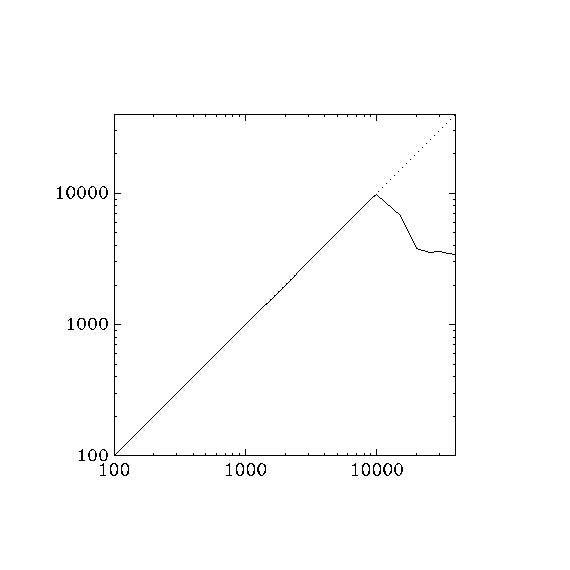
Looks much better, almost perfectly linear up to 10000 packets / second, then there's a dropoff. when the next scheduled send time falls behind faster than it can catch up (the actual number of packets sent falls farther and farther behind the expected number of packets sent). This gives the scan engine license to blast tons of packets in a vain attempt to catch up. While it's sending, incoming packets are dropped, causing a flood of retransmissions, which in turn leaves even less time to listen for incoming packets. This means that the actual packet per second can decrease as the requested packets per second increases, once past a certain threshold.
Temporary test revision
This was from a test where I modified doAnyNewProbes to go around the list of hosts only once.
static void doAnyNewProbes(UltraScanInfo *USI) {
  HostScanStats *hss, *start;

  gettimeofday(&USI->now, NULL);

  /* Loop around the list of incomplete hosts and send a probe to each if
     appropriate. Stop once we've been all the way through the list. */
  start = USI->nextIncompleteHost();
  if (start == NULL)
    return;
  hss = start;
  while (USI->gstats->sendOK(NULL)) {
    if (hss->freshPortsLeft() && hss->sendOK(NULL))
      sendNextScanProbe(USI, hss);
    hss = USI->nextIncompleteHost();
    if (hss == start)
      break;
  }
}
./nmap -PN --rate 100 -v localhost
Overall sending rates: 100.04 packets / s, 4401.56 bytes / s.
./nmap -PN --rate 200 -v localhost
Overall sending rates: 200.05 packets / s, 8802.08 bytes / s.
./nmap -PN --rate 300 -v localhost
Overall sending rates: 300.13 packets / s, 13205.54 bytes / s.
./nmap -PN --rate 400 -v localhost
Overall sending rates: 400.15 packets / s, 17606.49 bytes / s.
./nmap -PN --rate 500 -v localhost
Overall sending rates: 500.21 packets / s, 22009.23 bytes / s.
./nmap -PN --rate 600 -v localhost
Overall sending rates: 600.20 packets / s, 26408.69 bytes / s.
./nmap -PN --rate 700 -v localhost
Overall sending rates: 699.87 packets / s, 30794.27 bytes / s.
./nmap -PN --rate 800 -v localhost
Overall sending rates: 799.34 packets / s, 35171.06 bytes / s.
./nmap -PN --rate 900 -v localhost
Overall sending rates: 899.83 packets / s, 39592.61 bytes / s.
./nmap -PN --rate 1000 -v localhost
Overall sending rates: 998.47 packets / s, 43932.60 bytes / s.
./nmap -PN --rate 2000 -v localhost
Overall sending rates: 1999.90 packets / s, 87995.69 bytes / s.
./nmap -PN --rate 3000 -v localhost
Overall sending rates: 2992.09 packets / s, 131651.95 bytes / s.
./nmap -PN --rate 4000 -v localhost
Overall sending rates: 3981.32 packets / s, 175177.94 bytes / s.
./nmap -PN --rate 5000 -v localhost
Overall sending rates: 4980.64 packets / s, 219148.32 bytes / s.
./nmap -PN --rate 6000 -v localhost
Overall sending rates: 6022.91 packets / s, 265008.11 bytes / s.
./nmap -PN --rate 7000 -v localhost
Overall sending rates: 7028.66 packets / s, 309261.03 bytes / s.
./nmap -PN --rate 8000 -v localhost
Overall sending rates: 7914.20 packets / s, 348224.96 bytes / s.
./nmap -PN --rate 9000 -v localhost
Overall sending rates: 8953.14 packets / s, 393937.97 bytes / s.
./nmap -PN --rate 10000 -v localhost
Overall sending rates: 9954.61 packets / s, 438002.81 bytes / s.
./nmap -PN --rate 15000 -v localhost
Overall sending rates: 12649.27 packets / s, 556567.66 bytes / s.
./nmap -PN --rate 20000 -v localhost
Overall sending rates: 12442.86 packets / s, 547486.03 bytes / s.
./nmap -PN --rate 25000 -v localhost
Overall sending rates: 12611.31 packets / s, 554897.82 bytes / s.
./nmap -PN --rate 30000 -v localhost
Overall sending rates: 12206.49 packets / s, 537085.67 bytes / s.
./nmap -PN --rate 35000 -v localhost
Overall sending rates: 12483.53 packets / s, 549275.37 bytes / s.
./nmap -PN --rate 40000 -v localhost
Overall sending rates: 12560.24 packets / s, 552650.47 bytes / s.
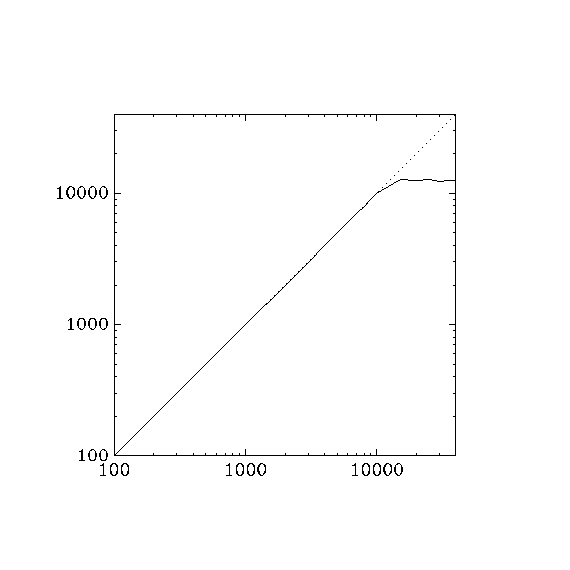
That's more like it! Unfortunately, the results aren't as good on non-localhost scans.
March 24, 2008
r6973
Here are graphs of current and average sending rates for some scans. The red line is the lifetime average of the scan, and the blue line is the average of the last five seconds.
nmap -PN -n -sS -p- -d3 localhost -oN localhost.nmap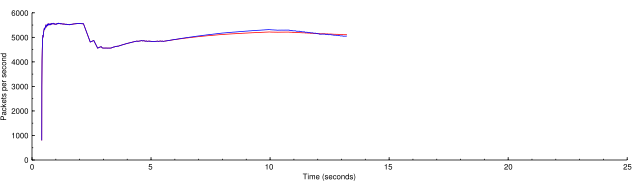
A normal scan on localhost. It would normally be faster but the -d3 option needed for making the graphs also uses a lot of CPU.
nmap -PN -n -sS -p- -d3 localhost --rate 3000 -oN localhost-rate-3000.nmap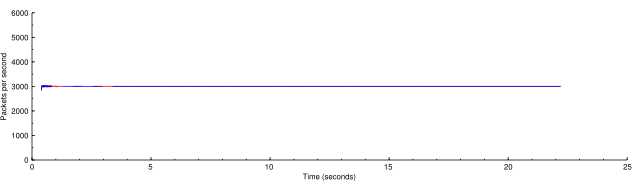
Now this is the same scan throttled down to 3000 packets per second.
nmap -PN -n -sS -p- -d3 localhost --rate 10000 -oN localhost-rate-10000.nmap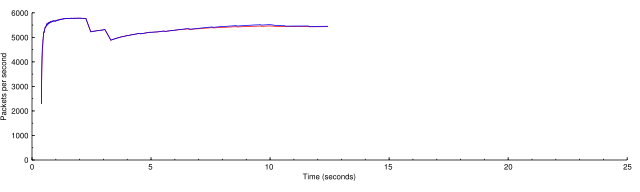
The limiting factor for a localhost scan is basically CPU. If we ask the scan to go faster than it can, it just goes the as fast as it can, the same as in the first graph.
nmap -PN -n -sS -p- -d3 scanme.nmap.org -oN scanme.nmap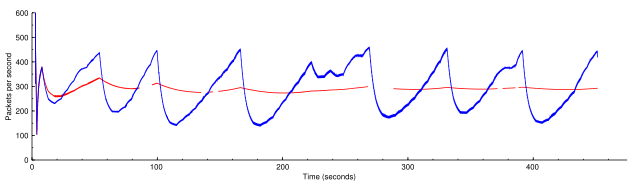
You can see the beautiful linear growth and exponential backoff of the congestion control algorithms, averaging at 75% of the maximum rate. I'm so proud!
nmap -PN -n -sS -p- -d3 --rate 500 scanme.nmap.org -oN scanme-rate-500.nmap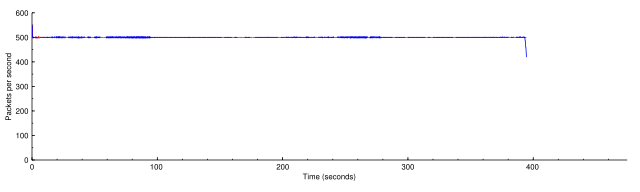
The rate fixer has no problem keeping the rate at almost exactly 500 packets per second. The drop at the end is waiting for the last probes to time out.
nmap -PN -n -sS -p- -d3 --rate 5000 scanme.nmap.org -oN scanme-rate-5000.nmap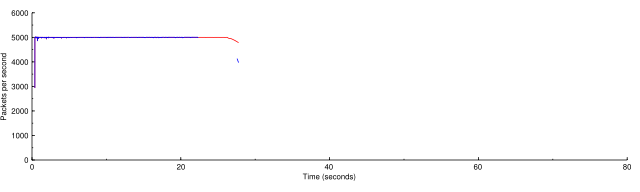
What if we push it up to 5000? (Note changed horizontal axis.) At this excessive rate Nmap found only 4 of the 6 non-filtered ports on scanme.
nmap -PN -n -sS -p- -d3 --rate 15000 scanme.nmap.org -oN scanme-rate-15000.nmap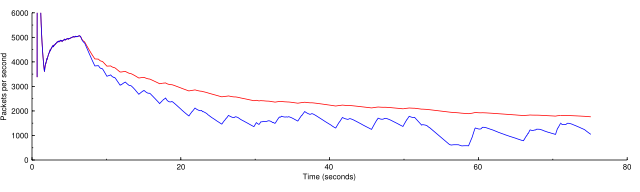
If we go too high, the scan actually slows down because of the issue noted in the log message of r6973. The rate is slowed by huge CPU delays dealing with all the outstanding probes. This is the wrong behavior in my opinion. When you give too high a rate it should just go as fast as it can. Luckily this is fixable.
March 25, 2008
r7002, minimum rate
In these graphs the green line is the minimum rate. The blue line is the current rate and the red line is the overall average rate.
nmap -PN -n -sS -p- -d3 scanme.nmap.org -oN scanme.nmap
nmap -PN -n -sS -p- -d3 scanme.nmap.org --min-rate 100 -oN scanme-min-rate-100.nmap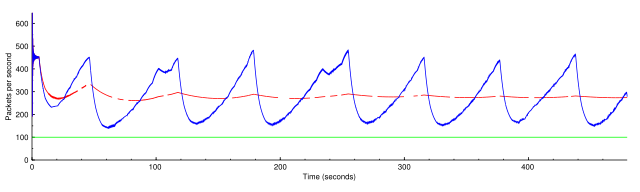
nmap -PN -n -sS -p- -d3 scanme.nmap.org --min-rate 350 -oN scanme-min-rate-350.nmap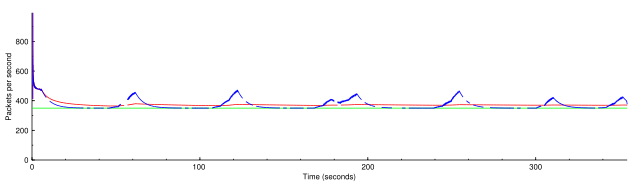
nmap -PN -n -sS -p- -d3 scanme.nmap.org --min-rate 500 -oN scanme-min-rate-500.nmap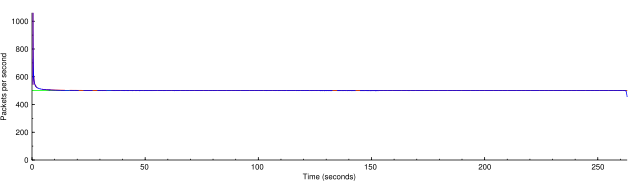
nmap -PN -n -sT -p- -d3 scanme.nmap.org -oN scanme-sT.nmap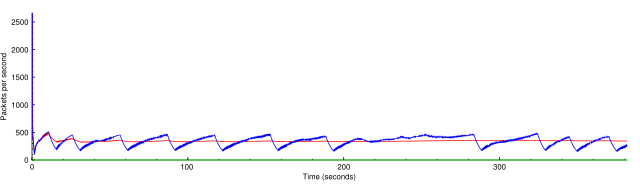
nmap -PN -n -sT -p- -d3 scanme.nmap.org --min-rate 100 -oN scanme-sT-min-rate-100.nmap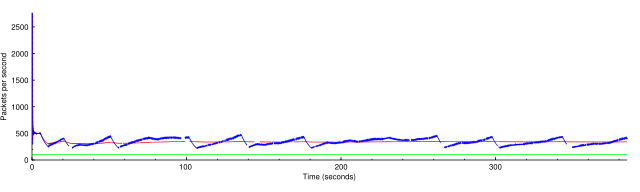
nmap -PN -n -sT -p- -d3 scanme.nmap.org --min-rate 350 -oN scanme-sT-min-rate-350.nmap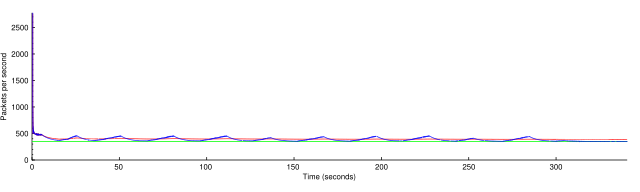
nmap -PN -n -sT -p- -d3 scanme.nmap.org --min-rate 500 -oN scanme-sT-min-rate-500.nmap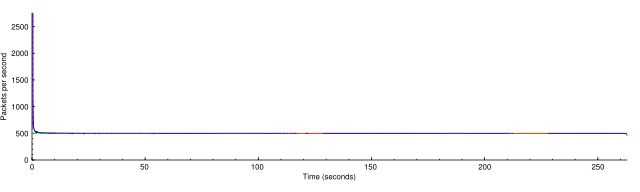
nmap -PN -n -sS -p- -d3 localhost --min-rate 5000 -oN localhost-min-rate-5000.nmap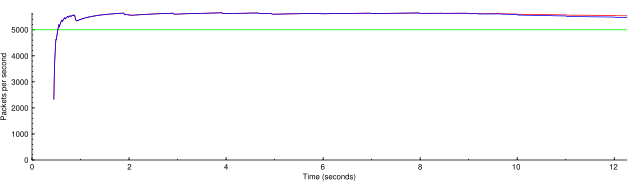
nmap -PN -n -sS -d3 192.168.2.0/24 --min-rate 2000 -oN lan-min-rate-2000.nmap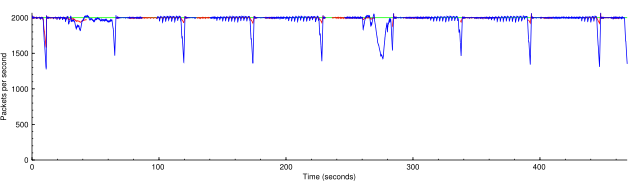
nmap -PN -n -sS -d3 192.168.2.0/24 --min-rate 10000 -oN lan-min-rate-10000.nmap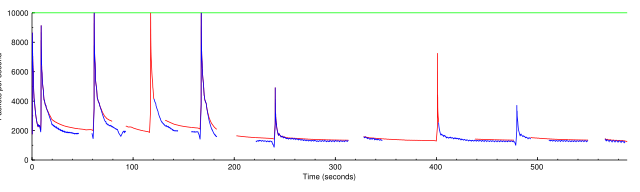
nmap -PN -n -sS -d3 192.168.2.0/24 --min-rate 10000 --max-retries 0 -oN lan-min-rate-10000-mr-0.nmap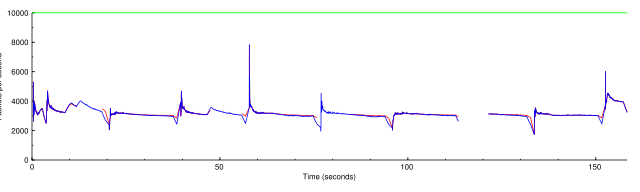
Reducing the inefficiency of doAnyOutstandingRetransmits
Or, making it possible to ask for a high a speed as you want want without penalty.
Before (r7151)
nmap -PN -n -d4 -p- 192.168.0.190
Overall rate 125.69 packets / s
nmap -PN -n -d4 -p- --min-rate 1000 192.168.0.190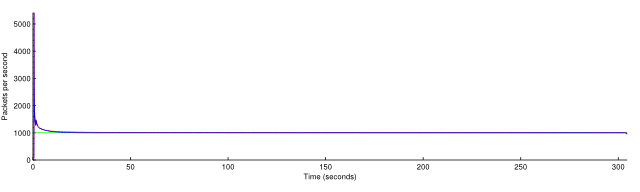
Overall rate 1002.50 packets / s
nmap -PN -n -d4 -p- --min-rate 5000 192.168.0.190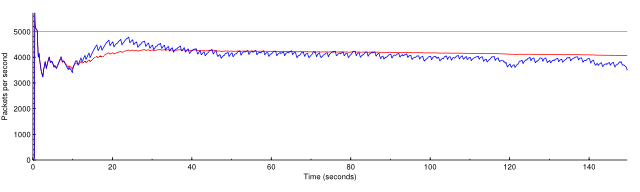
Overall rate 4056.31 packets / s
nmap -PN -n -d4 -p- --min-rate 10000 192.168.0.190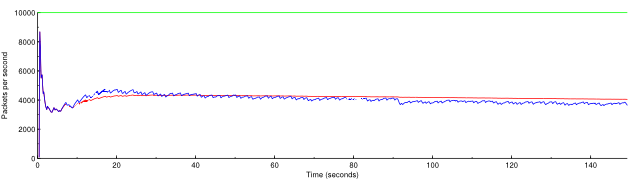
Overall rate 4048.45 packets / s
nmap -PN -n -d4 -p- --min-rate 50000 192.168.0.190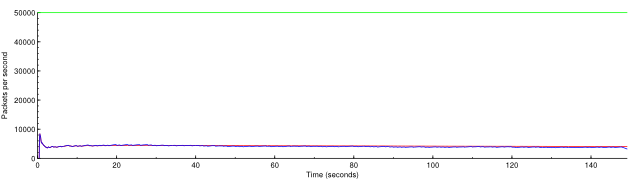
Overall rate 4043.21 packets / s
nmap -PN -n -d4 -p- --max-retries 0 192.168.0.190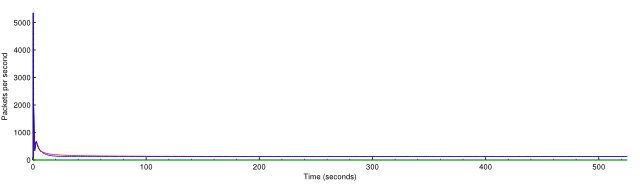
Overall rate 127.28 packets / s
nmap -PN -n -d4 -p- --min-rate 1000 --max-retries 0 192.168.0.190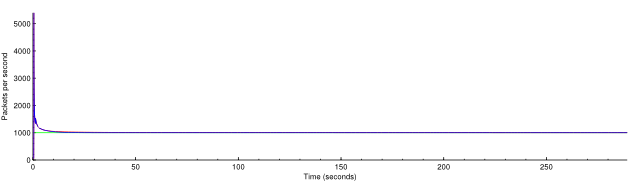
Overall rate 1001.70 packets / s
nmap -PN -n -d4 -p- --min-rate 5000 --max-retries 0 192.168.0.190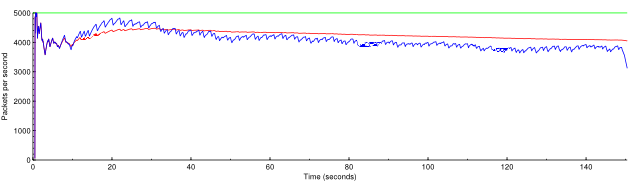
Overall rate 4047.28 packets / s
nmap -PN -n -d4 -p- --min-rate 10000 --max-retries 0 192.168.0.190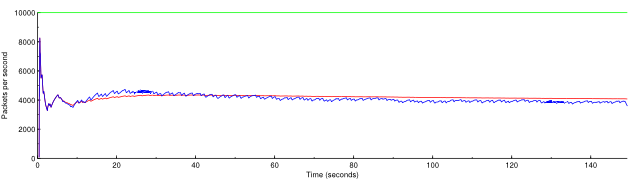
Overall rate 4074.05 packets / s
nmap -PN -n -d4 -p- --min-rate 50000 --max-retries 0 192.168.0.190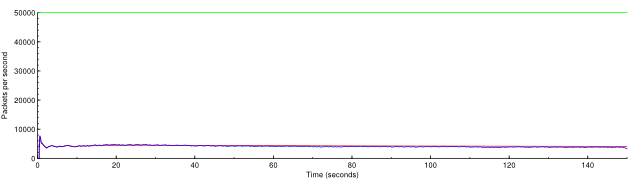
Overall rate 4071.59 packets / s
June 3, 2008
Here are graphs comparing the requested rate with the actual rate, for rates from 500–20000 packets per second. Note that we expect the actual rate to be slightly lower than the requested rate because of initialization and final timeouts.
Here are before and after pictures of r7916 in nmap-fixed-rate.
for rate in 100 200 300 400 500 1000 1500 2000 2500 3000 3500 4000 4500 5000 \
6000 7000 8000 9000 10000 15000 20000 25000 30000 35000 40000 45000 50000 \
60000 70000 80000 90000 100000; do
  echo -n "$rate "
  ./nmap -d --min-rate $rate -n -PN -p1-20000 --max-rtt-timeout 500 \
    --max-retries 1 scanme.nmap.org 2>/dev/null \
  | perl -e 'while (<>) { if (/^Nmap done:.*in (.*) seconds/) { $t = $1; }
    if (/Raw packets sent: (\d+) /) { $p = $1; } }
    print $p / $t . "\n"; print "# $p $t\n";'
done
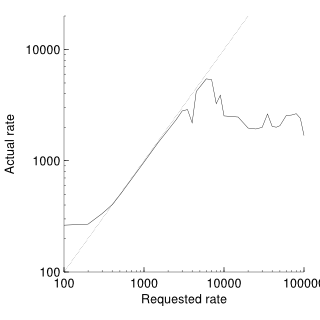
Before r7914 there is a big dropoff when the scan rate gets too high. After r7914 the scan pretty much flattens out at its maximum rate.
July 29, 2008
--max-rate testing.
r9191
nmap -PN -n -d3 --max-retries 0 -p- scanme.nmap.org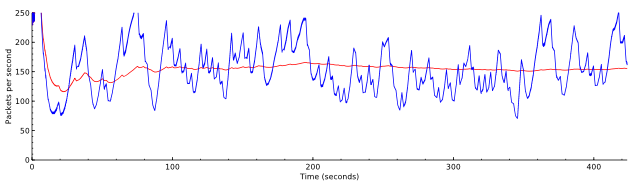
nmap -PN -n -d3 --max-retries 0 -p- --max-rate 150 scanme.nmap.org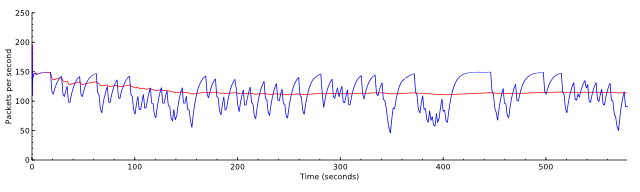
nmap -PN -n -d3 --max-retries 0 -p- --max-rate 120 scanme.nmap.org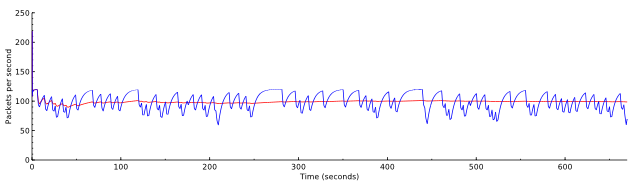
nmap -PN -n -d3 --max-retries 0 -p- --max-rate 80 scanme.nmap.org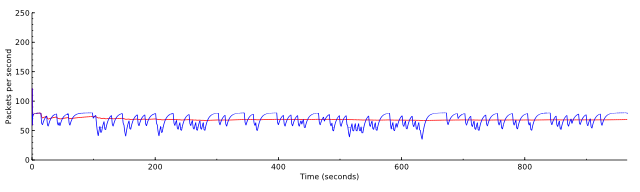
nmap -PN -n -d3 --max-retries 0 -p- --min-rate 150 --max-rate 200 scanme.nmap.org
nmap -PN -n -d3 --max-retries 0 -p- --min-rate 250 --max-rate 250 scanme.nmap.org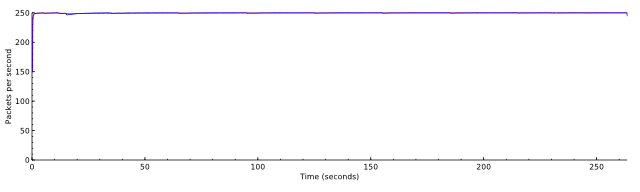
nmap -PN -n -d3 --max-retries 0 --max-rate 50 scanme.nmap.org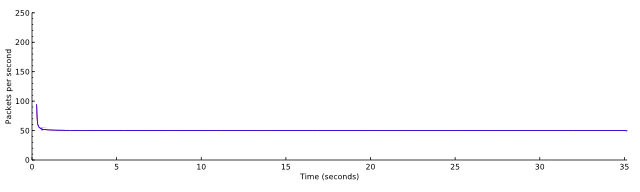
Problem: lag in the scheduler
The criterion for maximum rate seems to be simple. If --max-rate 500 is given, simply ensuring that no two packets are sent within 0.002 s of each other ensures that the maximum rate will never be exceeded.
The problem with the naive application of this rule is that other parts of ultra_scan take time too. A pcap read may take longer than 0.002 s. Say it takes 0.005 s. The send scheduler is now irrevocably behind schedule. Because pcap reads happen many times a second, the sender runs at a fraction of the maximum rate, even though with now maximum rate specified it is capable of going much faster.
Here are examples of scans against localhost. The first shows that around 4000 packets per second should be possible.
nmap -PN -n -d3 localhost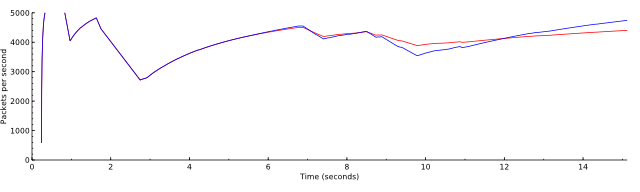
Overall sending rates: 4401.21 packets / s, 193653.35 bytes / s.
nmap -PN -n -d3 --max-rate 500 localhost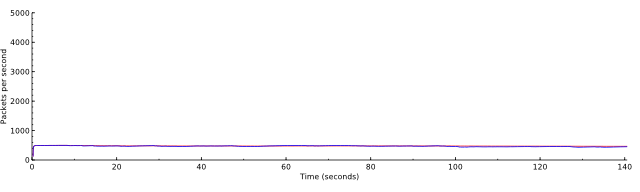
Overall sending rates: 466.95 packets / s, 20545.69 bytes / s.
nmap -PN -n -d3 --max-rate 2000 localhost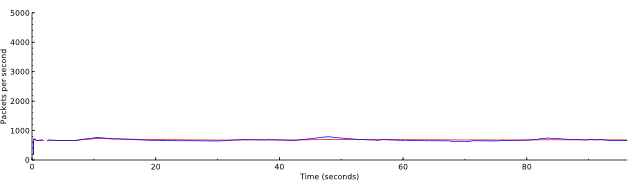
Overall sending rates: 682.59 packets / s, 30033.83 bytes / s.